Data
636,555 items of data are available, covering 496,989 participants.
Defined-instances run from 0 to 3, labelled using Instancing
2.
Units of measurement are cm.
| Maximum | 174 |
| Decile 9 | 145 |
| Decile 8 | 142.5 |
| Decile 7 | 141 |
| Decile 6 | 139 |
| Median | 137 |
| Decile 4 | 134 |
| Decile 3 | 131 |
| Decile 2 | 128 |
| Decile 1 | 125 |
| Minimum | 70 |
|
|
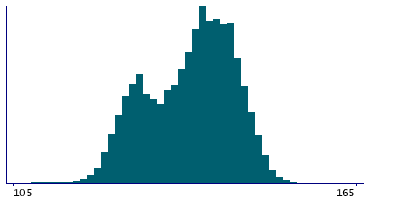
- Mean = 135.554
- Std.dev = 7.6288
- 64 items below graph minimum of 105
- 6 items above graph maximum of 165
|
4 Instances
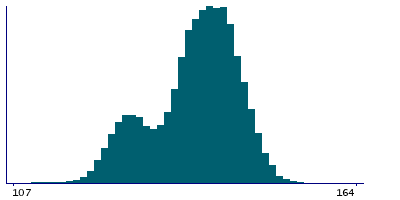
Instance 0 : Initial assessment visit (2006-2010) at which participants were recruited and consent given
495,666 participants, 495,666 items
| Maximum | 174 |
| Decile 9 | 145 |
| Decile 8 | 143 |
| Decile 7 | 141 |
| Decile 6 | 140 |
| Median | 138 |
| Decile 4 | 136 |
| Decile 3 | 134 |
| Decile 2 | 130 |
| Decile 1 | 126 |
| Minimum | 70 |
|
|
- Mean = 136.96
- Std.dev = 7.17837
- 78 items below graph minimum of 107
- 5 items above graph maximum of 164
|
Instance 1 : First repeat assessment visit (2012-13)
20,293 participants, 20,293 items
| Maximum | 156 |
| Decile 9 | 144 |
| Decile 8 | 141 |
| Decile 7 | 138 |
| Decile 6 | 134 |
| Median | 131 |
| Decile 4 | 128.3 |
| Decile 3 | 127 |
| Decile 2 | 125 |
| Decile 1 | 123 |
| Minimum | 70 |
|
|
- Mean = 132.343
- Std.dev = 7.90443
- 1 item below graph minimum of 102
|
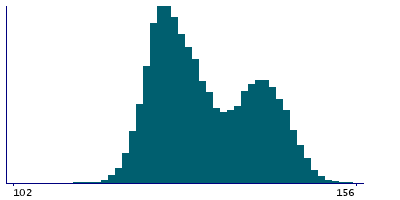
Instance 2 : Imaging visit (2014+)
99,774 participants, 99,774 items
| Maximum | 165.5 |
| Decile 9 | 142 |
| Decile 8 | 135 |
| Decile 7 | 132.5 |
| Decile 6 | 131 |
| Median | 129 |
| Decile 4 | 128 |
| Decile 3 | 126.5 |
| Decile 2 | 125 |
| Decile 1 | 123 |
| Minimum | 95 |
|
|
- Mean = 130.454
- Std.dev = 7.02147
- 18 items below graph minimum of 104
- 2 items above graph maximum of 161
|
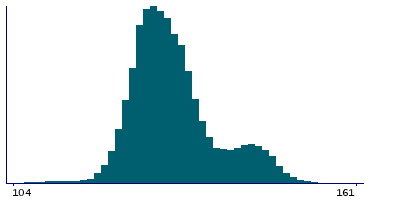
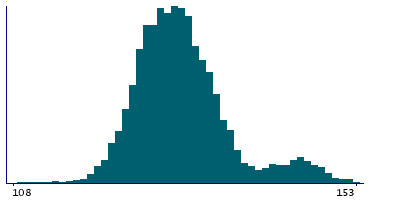
Instance 3 : First repeat imaging visit (2019+)
20,822 participants, 20,822 items
| Maximum | 162 |
| Decile 9 | 137 |
| Decile 8 | 133.5 |
| Decile 7 | 132 |
| Decile 6 | 130 |
| Median | 129 |
| Decile 4 | 127.5 |
| Decile 3 | 126 |
| Decile 2 | 125 |
| Decile 1 | 123 |
| Minimum | 104 |
|
|
- Mean = 129.661
- Std.dev = 6.24338
- 9 items below graph minimum of 109
- 47 items above graph maximum of 151
|

