Data
9,226 items of data are available, covering 4,613 participants.
Defined-instances run from 2 to 3, labelled using Instancing
2.
Units of measurement are AU.
| Maximum | 133.553 |
| Decile 9 | 99.2828 |
| Decile 8 | 97.8527 |
| Decile 7 | 96.8767 |
| Decile 6 | 96.0829 |
| Median | 95.3342 |
| Decile 4 | 94.5527 |
| Decile 3 | 93.6903 |
| Decile 2 | 92.6398 |
| Decile 1 | 90.9867 |
| Minimum | 67.8489 |
|
|
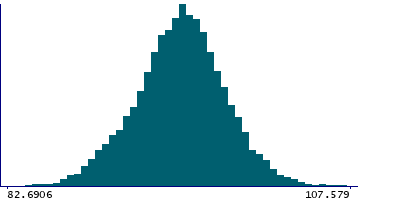
- Mean = 95.2437
- Std.dev = 3.30092
- 3 items below graph minimum of 82.6906
- 8 items above graph maximum of 107.579
|
2 Instances
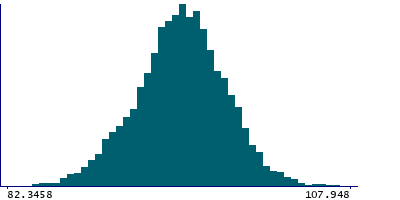
Instance 2 : Imaging visit (2014+)
4,613 participants, 4,613 items
| Maximum | 113.68 |
| Decile 9 | 99.4136 |
| Decile 8 | 98.0221 |
| Decile 7 | 96.9749 |
| Decile 6 | 96.1763 |
| Median | 95.3785 |
| Decile 4 | 94.5674 |
| Decile 3 | 93.701 |
| Decile 2 | 92.5896 |
| Decile 1 | 90.8797 |
| Minimum | 67.8489 |
|
|
- Mean = 95.2678
- Std.dev = 3.33971
- 1 item below graph minimum of 82.3458
- 1 item above graph maximum of 107.948
|
Instance 3 : First repeat imaging visit (2019+)
4,613 participants, 4,613 items
| Maximum | 133.553 |
| Decile 9 | 99.1073 |
| Decile 8 | 97.7281 |
| Decile 7 | 96.7913 |
| Decile 6 | 95.994 |
| Median | 95.3023 |
| Decile 4 | 94.5434 |
| Decile 3 | 93.6782 |
| Decile 2 | 92.6685 |
| Decile 1 | 91.1038 |
| Minimum | 70.8898 |
|

|
- Mean = 95.2196
- Std.dev = 3.26149
- 2 items below graph minimum of 83.1003
- 8 items above graph maximum of 107.111
|
Notes
Mean intensity of the corpus callosum - anterior in the whole brain generated by subcortical volumetric segmentation (aseg) with the longitudinal processing option in FreeSurfer.
0 Related Data-Fields
There are no related data-fields
0 Resources
There are no matching Resources
