Data
9,226 items of data are available, covering 4,613 participants.
Defined-instances run from 2 to 3, labelled using Instancing
2.
Units of measurement are AU.
| Maximum | 126.494 |
| Decile 9 | 98.0502 |
| Decile 8 | 96.0238 |
| Decile 7 | 94.9296 |
| Decile 6 | 94.0636 |
| Median | 93.2738 |
| Decile 4 | 92.5152 |
| Decile 3 | 91.6863 |
| Decile 2 | 90.6642 |
| Decile 1 | 89.2833 |
| Minimum | 58.6417 |
|

|
- Mean = 93.5408
- Std.dev = 3.73771
- 2 items below graph minimum of 80.5165
- 43 items above graph maximum of 106.817
|
2 Instances
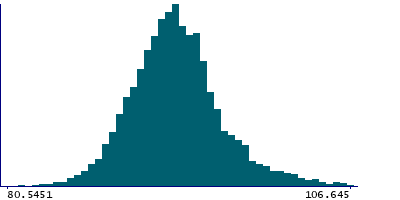
Instance 2 : Imaging visit (2014+)
4,613 participants, 4,613 items
| Maximum | 126.494 |
| Decile 9 | 97.9449 |
| Decile 8 | 95.8684 |
| Decile 7 | 94.8642 |
| Decile 6 | 93.9745 |
| Median | 93.2104 |
| Decile 4 | 92.4566 |
| Decile 3 | 91.647 |
| Decile 2 | 90.638 |
| Decile 1 | 89.245 |
| Minimum | 62.7609 |
|
|
- Mean = 93.458
- Std.dev = 3.67075
- 1 item below graph minimum of 80.5451
- 21 items above graph maximum of 106.645
|
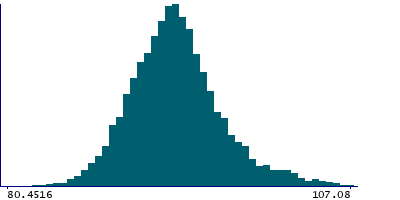
Instance 3 : First repeat imaging visit (2019+)
4,613 participants, 4,613 items
| Maximum | 124.484 |
| Decile 9 | 98.2039 |
| Decile 8 | 96.1761 |
| Decile 7 | 94.9868 |
| Decile 6 | 94.1338 |
| Median | 93.347 |
| Decile 4 | 92.5969 |
| Decile 3 | 91.7249 |
| Decile 2 | 90.6944 |
| Decile 1 | 89.3278 |
| Minimum | 58.6417 |
|
|
- Mean = 93.6236
- Std.dev = 3.80169
- 1 item below graph minimum of 80.4516
- 24 items above graph maximum of 107.08
|
Notes
Mean intensity of the corpus callosum - mid-anterior in the whole brain generated by subcortical volumetric segmentation (aseg) with the longitudinal processing option in FreeSurfer.
0 Related Data-Fields
There are no related data-fields
0 Resources
There are no matching Resources
