Data
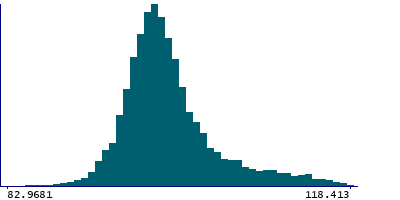
9,226 items of data are available, covering 4,613 participants.
Defined-instances run from 2 to 3, labelled using Instancing
2.
Units of measurement are AU.
| Maximum | 125.423 |
| Decile 9 | 106.598 |
| Decile 8 | 102.644 |
| Decile 7 | 100.812 |
| Decile 6 | 99.6794 |
| Median | 98.7497 |
| Decile 4 | 97.9456 |
| Decile 3 | 97.1195 |
| Decile 2 | 96.1565 |
| Decile 1 | 94.7831 |
| Minimum | 75.453 |
|

|
- Mean = 99.755
- Std.dev = 5.0601
- 4 items below graph minimum of 82.9681
- 37 items above graph maximum of 118.413
|
2 Instances
Instance 2 : Imaging visit (2014+)
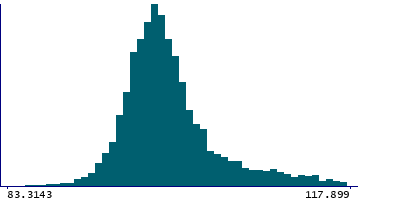
4,613 participants, 4,613 items
| Maximum | 125.423 |
| Decile 9 | 106.37 |
| Decile 8 | 102.524 |
| Decile 7 | 100.763 |
| Decile 6 | 99.6762 |
| Median | 98.7501 |
| Decile 4 | 97.9925 |
| Decile 3 | 97.1499 |
| Decile 2 | 96.1733 |
| Decile 1 | 94.8424 |
| Minimum | 79.2208 |
|

|
- Mean = 99.7285
- Std.dev = 4.96567
- 1 item below graph minimum of 83.3143
- 19 items above graph maximum of 117.899
|
Instance 3 : First repeat imaging visit (2019+)
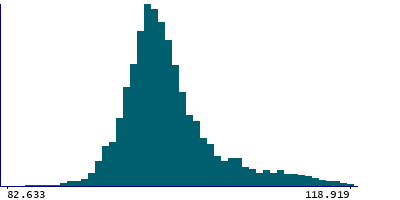
4,613 participants, 4,613 items
| Maximum | 122.365 |
| Decile 9 | 106.824 |
| Decile 8 | 102.755 |
| Decile 7 | 100.856 |
| Decile 6 | 99.6796 |
| Median | 98.7493 |
| Decile 4 | 97.8898 |
| Decile 3 | 97.0945 |
| Decile 2 | 96.1326 |
| Decile 1 | 94.7285 |
| Minimum | 75.453 |
|

|
- Mean = 99.7814
- Std.dev = 5.15267
- 3 items below graph minimum of 82.633
- 14 items above graph maximum of 118.919
|
Notes
Mean intensity of the corpus callosum - posterior in the whole brain generated by subcortical volumetric segmentation (aseg) with the longitudinal processing option in FreeSurfer.
0 Related Data-Fields
There are no related data-fields
0 Resources
There are no matching Resources


