Data
9,226 items of data are available, covering 4,613 participants.
Defined-instances run from 2 to 3, labelled using Instancing
2.
Units of measurement are AU.
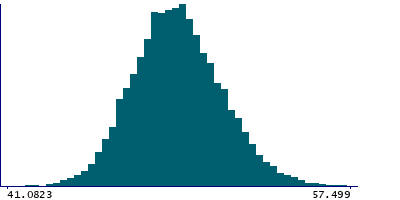
| Maximum | 61.1121 |
| Decile 9 | 52.0267 |
| Decile 8 | 50.9678 |
| Decile 7 | 50.2433 |
| Decile 6 | 49.6651 |
| Median | 49.1428 |
| Decile 4 | 48.609 |
| Decile 3 | 48.0727 |
| Decile 2 | 47.4298 |
| Decile 1 | 46.5545 |
| Minimum | 41.0322 |
|
|
- Mean = 49.2246
- Std.dev = 2.139
- 1 item below graph minimum of 41.0823
- 5 items above graph maximum of 57.499
|
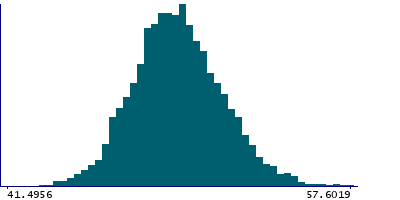
2 Instances
Instance 2 : Imaging visit (2014+)
4,613 participants, 4,613 items
| Maximum | 61.1121 |
| Decile 9 | 52.2331 |
| Decile 8 | 51.2283 |
| Decile 7 | 50.5068 |
| Decile 6 | 49.9165 |
| Median | 49.4051 |
| Decile 4 | 48.891 |
| Decile 3 | 48.3513 |
| Decile 2 | 47.7642 |
| Decile 1 | 46.8644 |
| Minimum | 41.0322 |
|
|
- Mean = 49.4939
- Std.dev = 2.10344
- 1 item below graph minimum of 41.4956
- 3 items above graph maximum of 57.6019
|
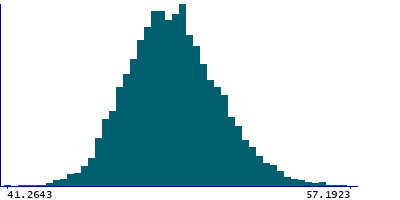
Instance 3 : First repeat imaging visit (2019+)
4,613 participants, 4,613 items
| Maximum | 57.4808 |
| Decile 9 | 51.751 |
| Decile 8 | 50.7448 |
| Decile 7 | 49.9913 |
| Decile 6 | 49.4012 |
| Median | 48.8745 |
| Decile 4 | 48.3265 |
| Decile 3 | 47.7873 |
| Decile 2 | 47.1555 |
| Decile 1 | 46.3097 |
| Minimum | 41.2643 |
|
|
- Mean = 48.9554
- Std.dev = 2.14037
- 1 item above graph maximum of 57.1923
|
Notes
Mean intensity of the choroid plexus in the right hemisphere generated by subcortical volumetric segmentation (aseg) with the longitudinal processing option in FreeSurfer.
1 Related Data-Field
| Field ID | Description | Relationship |
|---|
| 42965 | Mean intensity of choroid-plexus (le ... | Field 42965 is the left-side counterpart of right-side Current Field |
0 Resources
There are no matching Resources
