Data
9,226 items of data are available, covering 4,613 participants.
Defined-instances run from 2 to 3, labelled using Instancing
2.
Units of measurement are AU.
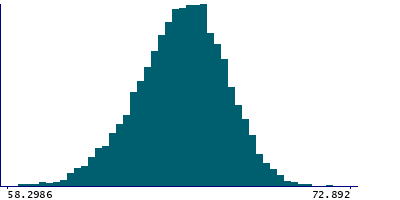
| Maximum | 90.5163 |
| Decile 9 | 68.0275 |
| Decile 8 | 67.2784 |
| Decile 7 | 66.7147 |
| Decile 6 | 66.2604 |
| Median | 65.7857 |
| Decile 4 | 65.3073 |
| Decile 3 | 64.7742 |
| Decile 2 | 64.1099 |
| Decile 1 | 63.163 |
| Minimum | 50.2961 |
|
|
- Mean = 65.6767
- Std.dev = 1.92836
- 5 items below graph minimum of 58.2986
- 2 items above graph maximum of 72.892
|
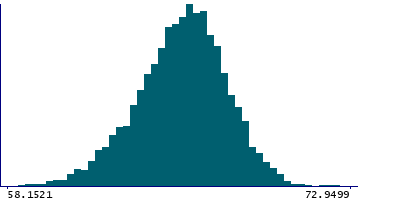
2 Instances
Instance 2 : Imaging visit (2014+)
4,613 participants, 4,613 items
| Maximum | 90.5163 |
| Decile 9 | 68.0173 |
| Decile 8 | 67.2336 |
| Decile 7 | 66.7013 |
| Decile 6 | 66.2399 |
| Median | 65.7895 |
| Decile 4 | 65.2895 |
| Decile 3 | 64.7706 |
| Decile 2 | 64.0881 |
| Decile 1 | 63.0847 |
| Minimum | 50.2961 |
|
|
- Mean = 65.662
- Std.dev = 1.95946
- 2 items below graph minimum of 58.1521
- 1 item above graph maximum of 72.9499
|
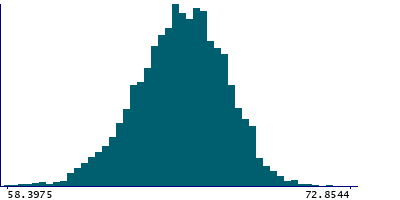
Instance 3 : First repeat imaging visit (2019+)
4,613 participants, 4,613 items
| Maximum | 73.183 |
| Decile 9 | 68.0354 |
| Decile 8 | 67.3124 |
| Decile 7 | 66.7361 |
| Decile 6 | 66.279 |
| Median | 65.7837 |
| Decile 4 | 65.3191 |
| Decile 3 | 64.7777 |
| Decile 2 | 64.1258 |
| Decile 1 | 63.2165 |
| Minimum | 57.8267 |
|
|
- Mean = 65.6915
- Std.dev = 1.89664
- 3 items below graph minimum of 58.3975
- 1 item above graph maximum of 72.8544
|
Notes
Mean intensity of the hippocampus in the right hemisphere generated by subcortical volumetric segmentation (aseg) with the longitudinal processing option in FreeSurfer.
1 Related Data-Field
| Field ID | Description | Relationship |
|---|
| 42959 | Mean intensity of Hippocampus (left ... | Field 42959 is the left-side counterpart of right-side Current Field |
0 Resources
There are no matching Resources
