Data
9,226 items of data are available, covering 4,613 participants.
Defined-instances run from 2 to 3, labelled using Instancing
2.
Units of measurement are AU.
| Maximum | 99.0484 |
| Decile 9 | 83.6801 |
| Decile 8 | 82.6921 |
| Decile 7 | 81.9653 |
| Decile 6 | 81.308 |
| Median | 80.5773 |
| Decile 4 | 79.7593 |
| Decile 3 | 78.6926 |
| Decile 2 | 77.2475 |
| Decile 1 | 75.1818 |
| Minimum | 64.436 |
|
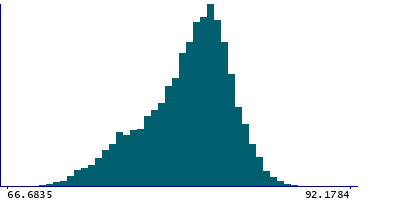
|
- Mean = 80.0048
- Std.dev = 3.26652
- 2 items below graph minimum of 66.6835
- 1 item above graph maximum of 92.1784
|
2 Instances
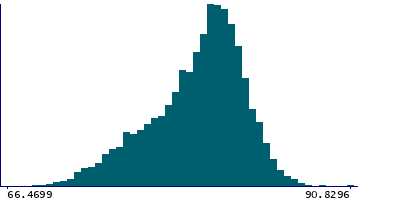
Instance 2 : Imaging visit (2014+)
4,613 participants, 4,613 items
| Maximum | 90.8296 |
| Decile 9 | 83.6135 |
| Decile 8 | 82.6468 |
| Decile 7 | 81.9119 |
| Decile 6 | 81.2355 |
| Median | 80.5541 |
| Decile 4 | 79.6922 |
| Decile 3 | 78.6385 |
| Decile 2 | 77.1407 |
| Decile 1 | 75.0417 |
| Minimum | 66.3384 |
|
|
- Mean = 79.9247
- Std.dev = 3.29033
- 1 item below graph minimum of 66.4699
|
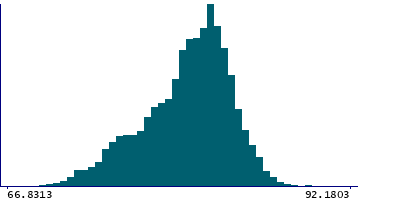
Instance 3 : First repeat imaging visit (2019+)
4,613 participants, 4,613 items
| Maximum | 99.0484 |
| Decile 9 | 83.7306 |
| Decile 8 | 82.7357 |
| Decile 7 | 82.0268 |
| Decile 6 | 81.3841 |
| Median | 80.6047 |
| Decile 4 | 79.8193 |
| Decile 3 | 78.7831 |
| Decile 2 | 77.3642 |
| Decile 1 | 75.2809 |
| Minimum | 64.436 |
|
|
- Mean = 80.0849
- Std.dev = 3.24056
- 1 item below graph minimum of 66.8313
- 1 item above graph maximum of 92.1803
|
Notes
Mean intensity of the putamen in the right hemisphere generated by subcortical volumetric segmentation (aseg) with the longitudinal processing option in FreeSurfer.
1 Related Data-Field
| Field ID | Description | Relationship |
|---|
| 42954 | Mean intensity of Putamen (left hemi ... | Field 42954 is the left-side counterpart of right-side Current Field |
0 Resources
There are no matching Resources
