Data
9,226 items of data are available, covering 4,613 participants.
Defined-instances run from 2 to 3, labelled using Instancing
2.
Units of measurement are AU.
| Maximum | 81.838 |
| Decile 9 | 71.9959 |
| Decile 8 | 70.9433 |
| Decile 7 | 70.2019 |
| Decile 6 | 69.5508 |
| Median | 68.9805 |
| Decile 4 | 68.4327 |
| Decile 3 | 67.8554 |
| Decile 2 | 67.1487 |
| Decile 1 | 66.1156 |
| Minimum | 54.6299 |
|

|
- Mean = 69.0537
- Std.dev = 2.34977
- 3 items below graph minimum of 60.2353
- 8 items above graph maximum of 77.8762
|
2 Instances
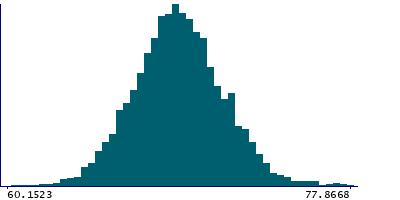
Instance 2 : Imaging visit (2014+)
4,613 participants, 4,613 items
| Maximum | 79.2182 |
| Decile 9 | 71.962 |
| Decile 8 | 70.8765 |
| Decile 7 | 70.1412 |
| Decile 6 | 69.507 |
| Median | 68.9416 |
| Decile 4 | 68.3983 |
| Decile 3 | 67.8259 |
| Decile 2 | 67.1093 |
| Decile 1 | 66.0572 |
| Minimum | 54.6299 |
|
|
- Mean = 69.0101
- Std.dev = 2.36564
- 1 item below graph minimum of 60.1523
- 6 items above graph maximum of 77.8668
|
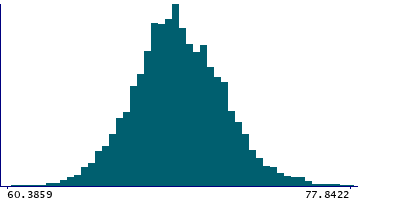
Instance 3 : First repeat imaging visit (2019+)
4,613 participants, 4,613 items
| Maximum | 81.838 |
| Decile 9 | 72.0234 |
| Decile 8 | 71.0104 |
| Decile 7 | 70.2653 |
| Decile 6 | 69.5925 |
| Median | 69.0003 |
| Decile 4 | 68.4587 |
| Decile 3 | 67.8837 |
| Decile 2 | 67.2129 |
| Decile 1 | 66.2047 |
| Minimum | 58.221 |
|
|
- Mean = 69.0974
- Std.dev = 2.33298
- 3 items below graph minimum of 60.3859
- 3 items above graph maximum of 77.8422
|
Notes
Mean intensity of the amygdala in the left hemisphere generated by subcortical volumetric segmentation (aseg) with the longitudinal processing option in FreeSurfer.
1 Related Data-Field
| Field ID | Description | Relationship |
|---|
| 42975 | Mean intensity of Amygdala (right he ... | Current Field is the left-side counterpart of right-side Field 42975 |
0 Resources
There are no matching Resources
