Data
9,226 items of data are available, covering 4,613 participants.
Defined-instances run from 2 to 3, labelled using Instancing
2.
Units of measurement are AU.
| Maximum | 114.837 |
| Decile 9 | 101.472 |
| Decile 8 | 99.6056 |
| Decile 7 | 98.368 |
| Decile 6 | 97.3516 |
| Median | 96.5025 |
| Decile 4 | 95.7385 |
| Decile 3 | 94.921 |
| Decile 2 | 94.052 |
| Decile 1 | 92.8542 |
| Minimum | 70.7754 |
|
|
- Mean = 96.8557
- Std.dev = 3.58665
- 7 items below graph minimum of 84.2364
- 17 items above graph maximum of 110.09
|
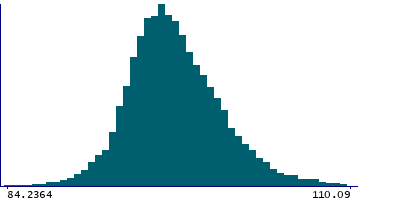
2 Instances
Instance 2 : Imaging visit (2014+)
4,613 participants, 4,613 items
| Maximum | 114.656 |
| Decile 9 | 101.161 |
| Decile 8 | 99.3776 |
| Decile 7 | 98.1794 |
| Decile 6 | 97.1885 |
| Median | 96.3287 |
| Decile 4 | 95.5864 |
| Decile 3 | 94.8163 |
| Decile 2 | 93.9322 |
| Decile 1 | 92.7485 |
| Minimum | 70.7754 |
|

|
- Mean = 96.6882
- Std.dev = 3.53082
- 3 items below graph minimum of 84.3356
- 8 items above graph maximum of 109.574
|
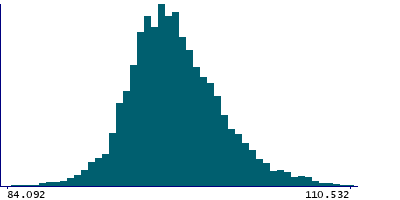
Instance 3 : First repeat imaging visit (2019+)
4,613 participants, 4,613 items
| Maximum | 114.837 |
| Decile 9 | 101.719 |
| Decile 8 | 99.8344 |
| Decile 7 | 98.5553 |
| Decile 6 | 97.5149 |
| Median | 96.7005 |
| Decile 4 | 95.8986 |
| Decile 3 | 95.0276 |
| Decile 2 | 94.2067 |
| Decile 1 | 92.9052 |
| Minimum | 81.3661 |
|
|
- Mean = 97.0232
- Std.dev = 3.63391
- 4 items below graph minimum of 84.092
- 7 items above graph maximum of 110.532
|
Notes
Mean intensity of the pallidum in the left hemisphere generated by subcortical volumetric segmentation (aseg) with the longitudinal processing option in FreeSurfer.
1 Related Data-Field
| Field ID | Description | Relationship |
|---|
| 42973 | Mean intensity of Pallidum (right he ... | Current Field is the left-side counterpart of right-side Field 42973 |
0 Resources
There are no matching Resources
