Data
9,226 items of data are available, covering 4,613 participants.
Defined-instances run from 2 to 3, labelled using Instancing
2.
Units of measurement are AU.
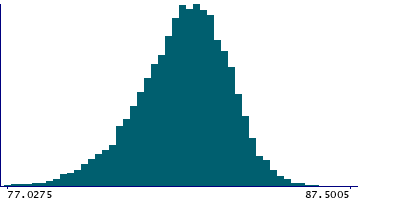
| Maximum | 87.5005 |
| Decile 9 | 84.0371 |
| Decile 8 | 83.5518 |
| Decile 7 | 83.1663 |
| Decile 6 | 82.8298 |
| Median | 82.4942 |
| Decile 4 | 82.1615 |
| Decile 3 | 81.7624 |
| Decile 2 | 81.2757 |
| Decile 1 | 80.5323 |
| Minimum | 45.2741 |
|
|
- Mean = 82.3681
- Std.dev = 1.49184
- 13 items below graph minimum of 77.0275
|
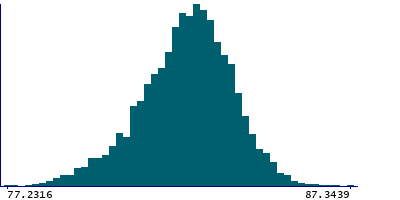
2 Instances
Instance 2 : Imaging visit (2014+)
4,613 participants, 4,613 items
| Maximum | 87.3439 |
| Decile 9 | 84.1037 |
| Decile 8 | 83.6217 |
| Decile 7 | 83.2326 |
| Decile 6 | 82.9074 |
| Median | 82.5968 |
| Decile 4 | 82.2662 |
| Decile 3 | 81.8851 |
| Decile 2 | 81.3979 |
| Decile 1 | 80.6676 |
| Minimum | 45.2741 |
|
|
- Mean = 82.4733
- Std.dev = 1.47965
- 7 items below graph minimum of 77.2316
|
Instance 3 : First repeat imaging visit (2019+)
4,613 participants, 4,613 items
| Maximum | 87.5005 |
| Decile 9 | 83.967 |
| Decile 8 | 83.4724 |
| Decile 7 | 83.0967 |
| Decile 6 | 82.7346 |
| Median | 82.3963 |
| Decile 4 | 82.043 |
| Decile 3 | 81.6454 |
| Decile 2 | 81.13 |
| Decile 1 | 80.4218 |
| Minimum | 51.4671 |
|

|
- Mean = 82.263
- Std.dev = 1.49656
- 5 items below graph minimum of 76.8765
|
Notes
Mean intensity of the cerebellum white matter in the left hemisphere generated by subcortical volumetric segmentation (aseg) with the longitudinal processing option in FreeSurfer.
1 Related Data-Field
| Field ID | Description | Relationship |
|---|
| 42968 | Mean intensity of Cerebellum-White-M ... | Current Field is the left-side counterpart of right-side Field 42968 |
0 Resources
There are no matching Resources
