Data
306,364 items of data are available, covering 243,183 participants.
Defined-instances run from 0 to 3, labelled using Instancing
2.
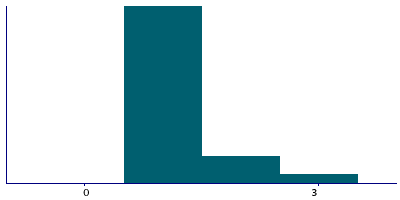
| Maximum | 98 |
| Decile 9 | 2 |
| Decile 8 | 2 |
| Decile 7 | 1 |
| Decile 6 | 1 |
| Median | 1 |
| Decile 4 | 1 |
| Decile 3 | 1 |
| Decile 2 | 1 |
| Decile 1 | 1 |
| Minimum | 0 |
|
|
- There are 59 distinct values.
- Mean = 1.4154
- Std.dev = 1.29473
- 14834 items above graph maximum of 3
|
4 Instances
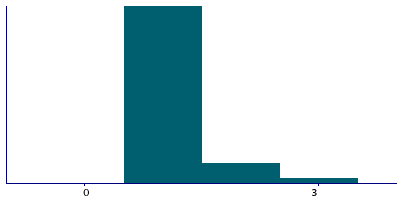
Instance 0 : Initial assessment visit (2006-2010) at which participants were recruited and consent given
171,365 participants, 171,365 items
| Maximum | 95 |
| Decile 9 | 2 |
| Decile 8 | 2 |
| Decile 7 | 1 |
| Decile 6 | 1 |
| Median | 1 |
| Decile 4 | 1 |
| Decile 3 | 1 |
| Decile 2 | 1 |
| Decile 1 | 1 |
| Minimum | 0 |
|

|
- There are 52 distinct values.
- Mean = 1.46906
- Std.dev = 1.40928
- 9196 items above graph maximum of 3
|
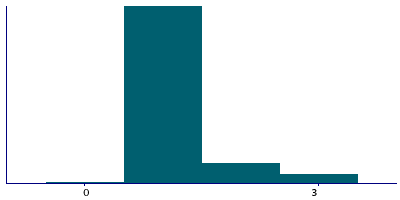
Instance 1 : First repeat assessment visit (2012-13)
20,308 participants, 20,308 items
| Maximum | 71 |
| Decile 9 | 2 |
| Decile 8 | 1 |
| Decile 7 | 1 |
| Decile 6 | 1 |
| Median | 1 |
| Decile 4 | 1 |
| Decile 3 | 1 |
| Decile 2 | 1 |
| Decile 1 | 1 |
| Minimum | 0 |
|
|
- There are 25 distinct values.
- Mean = 1.27733
- Std.dev = 1.11704
- 584 items above graph maximum of 3
|
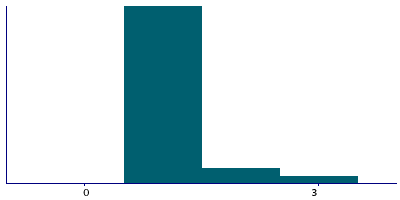
Instance 2 : Imaging visit (2014+)
94,752 participants, 94,752 items
| Maximum | 98 |
| Decile 9 | 2 |
| Decile 8 | 1 |
| Decile 7 | 1 |
| Decile 6 | 1 |
| Median | 1 |
| Decile 4 | 1 |
| Decile 3 | 1 |
| Decile 2 | 1 |
| Decile 1 | 1 |
| Minimum | 0 |
|
|
- There are 34 distinct values.
- Mean = 1.37178
- Std.dev = 1.1615
- 4309 items above graph maximum of 3
|
Instance 3 : First repeat imaging visit (2019+)
19,939 participants, 19,939 items
| Maximum | 26 |
| Decile 9 | 2 |
| Decile 8 | 1 |
| Decile 7 | 1 |
| Decile 6 | 1 |
| Median | 1 |
| Decile 4 | 1 |
| Decile 3 | 1 |
| Decile 2 | 1 |
| Decile 1 | 1 |
| Minimum | 0 |
|
|
- There are 20 distinct values.
- Mean = 1.30207
- Std.dev = 0.969406
- 745 items above graph maximum of 3
|


