Data
99,999 items of data are available, covering 91,199 participants.
Defined-instances run from 0 to 3, labelled using Instancing
2.
Units of measurement are deciseconds.
| Maximum | 49530 |
| Decile 9 | 1805 |
| Decile 8 | 1596 |
| Decile 7 | 1475 |
| Decile 6 | 1380 |
| Median | 1299 |
| Decile 4 | 1222 |
| Decile 3 | 1143 |
| Decile 2 | 1055 |
| Decile 1 | 937 |
| Minimum | 0 |
|

|
- There are 2965 distinct values.
- Mean = 1343.61
- Std.dev = 432.819
- 886 items above graph maximum of 2673
|
3 Instances
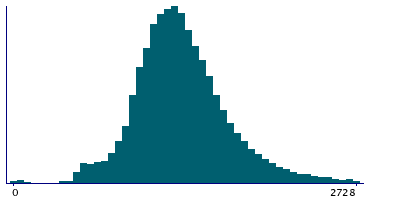
Instance 0 : Initial assessment visit (2006-2010) at which participants were recruited and consent given
51,757 participants, 51,757 items
| Maximum | 49530 |
| Decile 9 | 1829 |
| Decile 8 | 1609 |
| Decile 7 | 1485 |
| Decile 6 | 1387 |
| Median | 1304 |
| Decile 4 | 1226 |
| Decile 3 | 1144 |
| Decile 2 | 1055 |
| Decile 1 | 930 |
| Minimum | 15 |
|
|
- There are 2707 distinct values.
- Mean = 1353.43
- Std.dev = 473.941
- 492 items above graph maximum of 2728
|
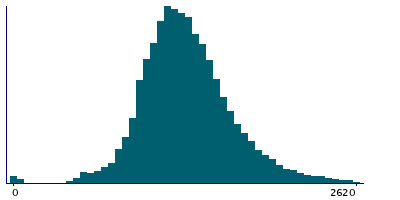
Instance 2 : Imaging visit (2014+)
43,149 participants, 43,149 items
| Maximum | 6558 |
| Decile 9 | 1783.5 |
| Decile 8 | 1585 |
| Decile 7 | 1468 |
| Decile 6 | 1375 |
| Median | 1294 |
| Decile 4 | 1218 |
| Decile 3 | 1143 |
| Decile 2 | 1057 |
| Decile 1 | 946 |
| Minimum | 0 |
|
|
- There are 2427 distinct values.
- Mean = 1336.64
- Std.dev = 383.64
- 342 items above graph maximum of 2621
|
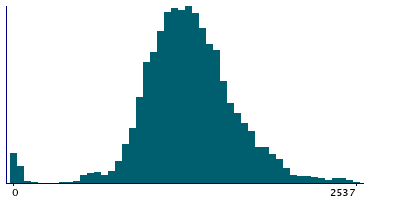
Instance 3 : First repeat imaging visit (2019+)
5,093 participants, 5,093 items
| Maximum | 4367 |
| Decile 9 | 1735 |
| Decile 8 | 1555 |
| Decile 7 | 1449 |
| Decile 6 | 1361 |
| Median | 1287 |
| Decile 4 | 1210 |
| Decile 3 | 1133 |
| Decile 2 | 1046.5 |
| Decile 1 | 933 |
| Minimum | 12 |
|
|
- There are 1380 distinct values.
- Mean = 1302.89
- Std.dev = 381.486
- 36 items above graph maximum of 2537
|


