Data
218,589 items of data are available, covering 196,562 participants.
Defined-instances run from 0 to 3, labelled using Instancing
2.
Units of measurement are mm.
| Maximum | 67.751 |
| Decile 9 | 50.1649 |
| Decile 8 | 47.96 |
| Decile 7 | 46.39 |
| Decile 6 | 45.0849 |
| Median | 43.868 |
| Decile 4 | 42.704 |
| Decile 3 | 41.487 |
| Decile 2 | 40.128 |
| Decile 1 | 38.3469 |
| Minimum | 10.054 |
|
|
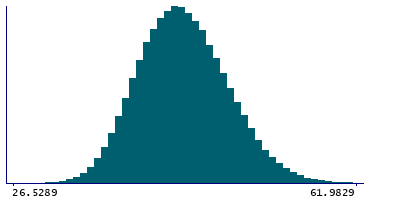
- Mean = 44.0918
- Std.dev = 4.61878
- 21 items below graph minimum of 26.5289
- 64 items above graph maximum of 61.9829
|
4 Instances
Instance 0 : Initial assessment visit (2006-2010) at which participants were recruited and consent given
164,016 participants, 164,016 items
| Maximum | 67.751 |
| Decile 9 | 50.112 |
| Decile 8 | 47.889 |
| Decile 7 | 46.302 |
| Decile 6 | 44.997 |
| Median | 43.797 |
| Decile 4 | 42.633 |
| Decile 3 | 41.416 |
| Decile 2 | 40.058 |
| Decile 1 | 38.276 |
| Minimum | 10.054 |
|

|
- Mean = 44.0272
- Std.dev = 4.62808
- 17 items below graph minimum of 26.44
- 52 items above graph maximum of 61.948
|
Instance 1 : First repeat assessment visit (2012-13)
19,794 participants, 19,794 items
| Maximum | 66.834 |
| Decile 9 | 50.015 |
| Decile 8 | 47.889 |
| Decile 7 | 46.425 |
| Decile 6 | 45.156 |
| Median | 43.974 |
| Decile 4 | 42.792 |
| Decile 3 | 41.61 |
| Decile 2 | 40.27 |
| Decile 1 | 38.47 |
| Minimum | 23.424 |
|

|
- Mean = 44.1416
- Std.dev = 4.51092
- 2 items below graph minimum of 26.925
- 8 items above graph maximum of 61.56
|
Instance 2 : Imaging visit (2014+)
34,395 participants, 34,395 items
| Maximum | 66.9395 |
| Decile 9 | 50.4207 |
| Decile 8 | 48.2776 |
| Decile 7 | 46.7077 |
| Decile 6 | 45.4201 |
| Median | 44.1853 |
| Decile 4 | 43.0035 |
| Decile 3 | 41.7512 |
| Decile 2 | 40.3577 |
| Decile 1 | 38.5586 |
| Minimum | 21.0255 |
|

|
- Mean = 44.3747
- Std.dev = 4.62509
- 1 item below graph minimum of 26.6964
- 6 items above graph maximum of 62.2828
|
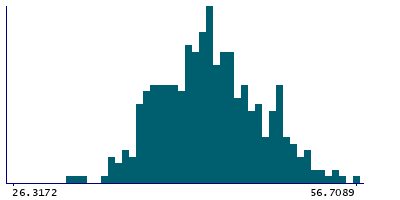
Instance 3 : First repeat imaging visit (2019+)
384 participants, 384 items
| Maximum | 56.7089 |
| Decile 9 | 49.918 |
| Decile 8 | 47.916 |
| Decile 7 | 45.9228 |
| Decile 6 | 44.8027 |
| Median | 43.6385 |
| Decile 4 | 42.5802 |
| Decile 3 | 41.4778 |
| Decile 2 | 39.8109 |
| Decile 1 | 38.1176 |
| Minimum | 25.3823 |
|
|
- Mean = 43.8007
- Std.dev = 4.57804
- 1 item below graph minimum of 26.3172
|


