Data
3,796,961 items of data are available, covering 494,085 participants.
Defined-instances run from 0 to 3, labelled using Instancing
2.
Array indices run from 0 to 11.
Units of measurement are milliseconds.
| Maximum | 121281 |
| Decile 9 | 766 |
| Decile 8 | 672 |
| Decile 7 | 610 |
| Decile 6 | 578 |
| Median | 547 |
| Decile 4 | 516 |
| Decile 3 | 485 |
| Decile 2 | 454 |
| Decile 1 | 422 |
| Minimum | 0 |
|

|
- There are 785 distinct values.
- Mean = 582.23
- Std.dev = 191.349
- 61521 items above graph maximum of 1110
|
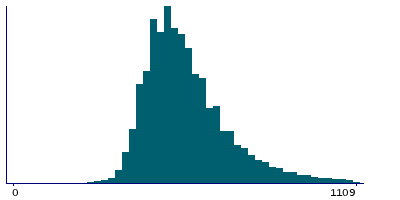
4 Instances
Instance 0 : Initial assessment visit (2006-2010) at which participants were recruited and consent given
492,690 participants, 2,984,804 items
| Maximum | 121281 |
| Decile 9 | 765 |
| Decile 8 | 657 |
| Decile 7 | 609 |
| Decile 6 | 563 |
| Median | 532 |
| Decile 4 | 515 |
| Decile 3 | 484 |
| Decile 2 | 453 |
| Decile 1 | 421 |
| Minimum | 0 |
|
|
- There are 473 distinct values.
- Mean = 574.118
- Std.dev = 194.746
- 49501 items above graph maximum of 1109
|
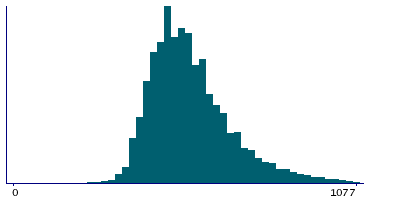
Instance 1 : First repeat assessment visit (2012-13)
20,245 participants, 122,680 items
| Maximum | 2968 |
| Decile 9 | 749 |
| Decile 8 | 657 |
| Decile 7 | 609 |
| Decile 6 | 563 |
| Median | 532 |
| Decile 4 | 515 |
| Decile 3 | 484 |
| Decile 2 | 453 |
| Decile 1 | 421 |
| Minimum | 15 |
|
|
- There are 267 distinct values.
- Mean = 568.481
- Std.dev = 165.157
- 1828 items above graph maximum of 1077
|
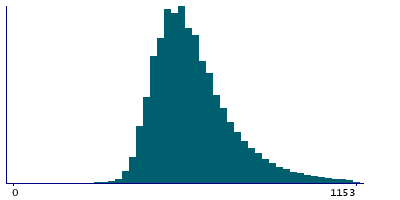
Instance 2 : Imaging visit (2014+)
94,405 participants, 569,795 items
| Maximum | 3010 |
| Decile 9 | 797 |
| Decile 8 | 703 |
| Decile 7 | 655 |
| Decile 6 | 610 |
| Median | 579 |
| Decile 4 | 561 |
| Decile 3 | 530 |
| Decile 2 | 499 |
| Decile 1 | 467 |
| Minimum | 0 |
|
|
- There are 691 distinct values.
- Mean = 619.577
- Std.dev = 176.28
- 9484 items above graph maximum of 1127
|
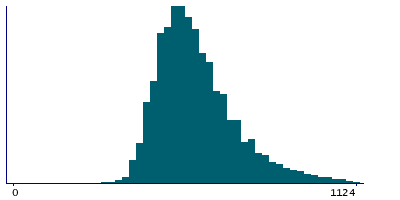
Instance 3 : First repeat imaging visit (2019+)
19,827 participants, 119,682 items
| Maximum | 2985 |
| Decile 9 | 797 |
| Decile 8 | 704 |
| Decile 7 | 656 |
| Decile 6 | 624 |
| Median | 592 |
| Decile 4 | 562 |
| Decile 3 | 531 |
| Decile 2 | 500 |
| Decile 1 | 468 |
| Minimum | 0 |
|
|
- There are 452 distinct values.
- Mean = 620.839
- Std.dev = 172.88
- 1901 items above graph maximum of 1126
|
Notes
This gives the interval between the cards being displayed and the participant pressing the snap-button to indicate a match. Note that the time is recorded regardless of whether the cards shown formed a matching pair.
Field 401 and
Field 402 need to be compared to determine if the cards were the same.
Each pair was displayed for 2 seconds, followed by a 1 second gap. If the button-press occurred during a gap then it was recorded against the previous pair, giving a value in the range 2001-2999ms.


