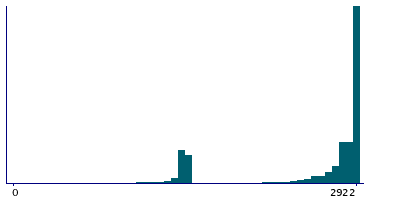
Data
55,290 items are available, covering 53,039 participants.
Defined-instances run from 0 to 3, labelled using Instancing
2.
Units of measurement are number of proteins.
| Maximum | 2922 |
| Decile 9 | 2920 |
| Decile 8 | 2919 |
| Decile 7 | 2917 |
| Decile 6 | 2913 |
| Median | 2894 |
| Decile 4 | 2817 |
| Decile 3 | 2729 |
| Decile 2 | 2315 |
| Decile 1 | 1460 |
| Minimum | 75 |
|
|
- There are 1322 distinct values.
- Mean = 2572.34
- Std.dev = 573.477
|
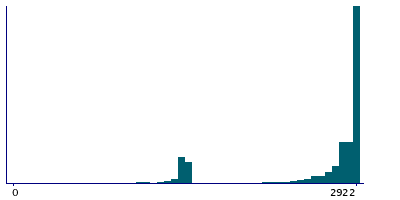
3 Instances
Instance 0 : Initial assessment visit (2006-2010) at which participants were recruited and consent given
52,995 participants, 52,995 items
| Maximum | 2922 |
| Decile 9 | 2920 |
| Decile 8 | 2919 |
| Decile 7 | 2917 |
| Decile 6 | 2914 |
| Median | 2905 |
| Decile 4 | 2823 |
| Decile 3 | 2771 |
| Decile 2 | 2556 |
| Decile 1 | 1461 |
| Minimum | 75 |
|
|
- There are 1296 distinct values.
- Mean = 2621.82
- Std.dev = 532.565
|
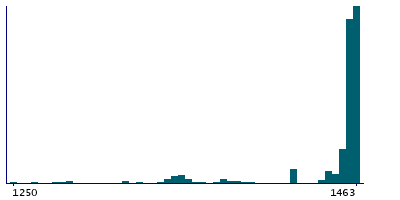
Instance 2 : Imaging visit (2014+)
1,172 participants, 1,172 items
| Maximum | 1463 |
| Decile 9 | 1462 |
| Decile 8 | 1462 |
| Decile 7 | 1461 |
| Decile 6 | 1461 |
| Median | 1461 |
| Decile 4 | 1459 |
| Decile 3 | 1457 |
| Decile 2 | 1448 |
| Decile 1 | 1356 |
| Minimum | 359 |
|
|
- There are 109 distinct values.
- Mean = 1428.9
- Std.dev = 109.761
- 43 items below graph minimum of 1250
|
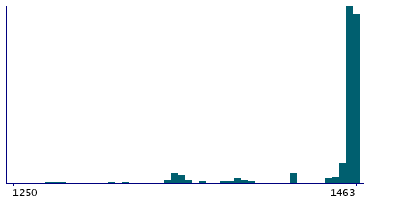
Instance 3 : First repeat imaging visit (2019+)
1,123 participants, 1,123 items
| Maximum | 1463 |
| Decile 9 | 1462 |
| Decile 8 | 1462 |
| Decile 7 | 1461 |
| Decile 6 | 1461 |
| Median | 1461 |
| Decile 4 | 1460 |
| Decile 3 | 1458 |
| Decile 2 | 1456 |
| Decile 1 | 1356 |
| Minimum | 365 |
|
|
- There are 86 distinct values.
- Mean = 1430.58
- Std.dev = 106.306
- 41 items below graph minimum of 1250
|


