Data
501,983 items of data are available, covering 477,953 participants.
Defined-instances run from 0 to 2, labelled using Instancing
2.
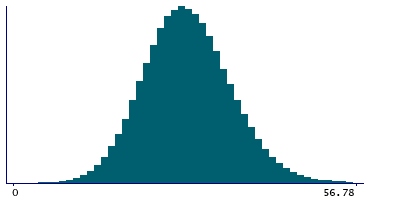
Units of measurement are percent.
| Maximum | 98.7 |
| Decile 9 | 38.29 |
| Decile 8 | 34.8 |
| Decile 7 | 32.4 |
| Decile 6 | 30.4 |
| Median | 28.54 |
| Decile 4 | 26.75 |
| Decile 3 | 24.88 |
| Decile 2 | 22.7 |
| Decile 1 | 19.8 |
| Minimum | 0 |
|
|
- Mean = 28.8777
- Std.dev = 7.50842
- 1148 items above graph maximum of 56.78
|
3 Instances
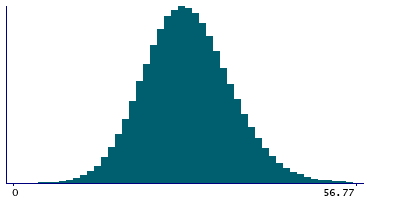
Instance 0 : Initial assessment visit (2006-2010) at which participants were recruited and consent given
476,756 participants, 476,756 items
| Maximum | 98.7 |
| Decile 9 | 38.3 |
| Decile 8 | 34.8 |
| Decile 7 | 32.4 |
| Decile 6 | 30.4 |
| Median | 28.59 |
| Decile 4 | 26.8 |
| Decile 3 | 24.9 |
| Decile 2 | 22.76 |
| Decile 1 | 19.83 |
| Minimum | 0 |
|
|
- Mean = 28.9126
- Std.dev = 7.4995
- 1102 items above graph maximum of 56.77
|
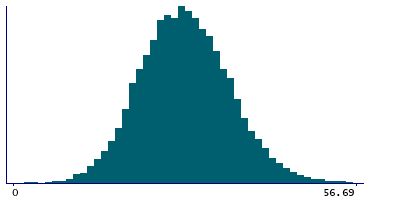
Instance 1 : First repeat assessment visit (2012-13)
19,379 participants, 19,379 items
| Maximum | 91.2 |
| Decile 9 | 37.965 |
| Decile 8 | 34.6 |
| Decile 7 | 32.1 |
| Decile 6 | 30.005 |
| Median | 28.1 |
| Decile 4 | 26.3 |
| Decile 3 | 24.3 |
| Decile 2 | 22.1 |
| Decile 1 | 19.2 |
| Minimum | 0 |
|
|
- Mean = 28.4432
- Std.dev = 7.6555
- 35 items above graph maximum of 56.73
|
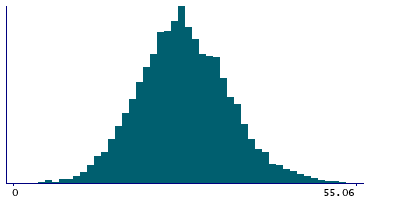
Instance 2 : Imaging visit (2014+)
5,848 participants, 5,848 items
| Maximum | 92.1 |
| Decile 9 | 36.665 |
| Decile 8 | 33.39 |
| Decile 7 | 31.11 |
| Decile 6 | 28.94 |
| Median | 27.13 |
| Decile 4 | 25.45 |
| Decile 3 | 23.51 |
| Decile 2 | 21.285 |
| Decile 1 | 18.27 |
| Minimum | 3.21 |
|
|
- Mean = 27.473
- Std.dev = 7.56359
- 14 items above graph maximum of 55.06
|
Notes
Result of "Lymphocytes Percentage" assay, performed on blood sample, obtained from UK Biobank assessment centre visit. Lymphocytes (Percentage) is calculated as the proportion of lymphocytes in the leukocytes.
4 Related Data-Fields
| Field ID | Description | Relationship |
|---|
| 30184 | Lymphocyte percentage acquisition route | Field 30184 is the data route used to acquire the result in Current Field |
| 30182 | Lymphocyte percentage acquisition time | Field 30182 is the original acquisition time of the sample generating the result in Current Field. |
| 30183 | Lymphocyte percentage device ID | Field 30183 is the ID of the device user to generate the result in Current Field |
| 30181 | Lymphocyte percentage freeze-thaw cycles | Field 30181 is the number of freeze-thaw cycles a sample underwent before generating the result in Current Field. |
1 Application
| Application ID | Title |
|---|
| 45925 | Risk Factors, Biomarkers and Impact of Major Vision-Threatening Eye Diseases |

