Data
90,479 items of data are available, covering 85,381 participants.
Defined-instances run from 2 to 3, labelled using Instancing
2.
Units of measurement are AU.
| Maximum | 0.933409 |
| Decile 9 | 0.32584 |
| Decile 8 | 0.288216 |
| Decile 7 | 0.262119 |
| Decile 6 | 0.239756 |
| Median | 0.219085 |
| Decile 4 | 0.197189 |
| Decile 3 | 0.173695 |
| Decile 2 | 0.145836 |
| Decile 1 | 0.103433 |
| Minimum | 0.00117162 |
|

|
- Mean = 0.217333
- Std.dev = 0.0862416
- 33 items above graph maximum of 0.548247
|
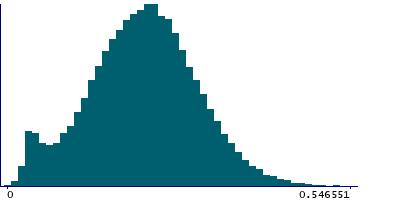
2 Instances
Instance 2 : Imaging visit (2014+)
85,291 participants, 85,291 items
| Maximum | 0.933409 |
| Decile 9 | 0.323376 |
| Decile 8 | 0.285983 |
| Decile 7 | 0.259867 |
| Decile 6 | 0.237486 |
| Median | 0.216757 |
| Decile 4 | 0.194957 |
| Decile 3 | 0.171402 |
| Decile 2 | 0.143268 |
| Decile 1 | 0.100201 |
| Minimum | 0.00117162 |
|
|
- Mean = 0.214957
- Std.dev = 0.0861943
- 29 items above graph maximum of 0.546551
|
Instance 3 : First repeat imaging visit (2019+)
5,188 participants, 5,188 items
| Maximum | 0.742053 |
| Decile 9 | 0.355338 |
| Decile 8 | 0.320151 |
| Decile 7 | 0.294768 |
| Decile 6 | 0.273145 |
| Median | 0.253907 |
| Decile 4 | 0.235026 |
| Decile 3 | 0.214325 |
| Decile 2 | 0.191602 |
| Decile 1 | 0.160121 |
| Minimum | 0.034773 |
|

|
- Mean = 0.256396
- Std.dev = 0.0771559
- 5 items above graph maximum of 0.550555
|
Notes
Standard deviation of the Z linear component of the dMRI eddy currents as calculated by FSL's eddy
0 Related Data-Fields
There are no related data-fields


