Data
502,877 items of data are available, covering 478,810 participants.
Defined-instances run from 0 to 2, labelled using Instancing
2.
Units of measurement are 10^9 cells/Litre.
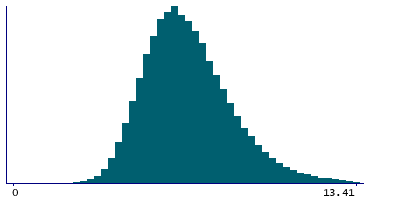
| Maximum | 389.7 |
| Decile 9 | 9.12 |
| Decile 8 | 8.19 |
| Decile 7 | 7.57 |
| Decile 6 | 7.09 |
| Median | 6.65 |
| Decile 4 | 6.25 |
| Decile 3 | 5.85 |
| Decile 2 | 5.4 |
| Decile 1 | 4.83 |
| Minimum | 0 |
|
|
- Mean = 6.88125
- Std.dev = 2.13216
- 2246 items above graph maximum of 13.41
|
3 Instances
Instance 0 : Initial assessment visit (2006-2010) at which participants were recruited and consent given
477,633 participants, 477,633 items
| Maximum | 389.7 |
| Decile 9 | 9.14 |
| Decile 8 | 8.2 |
| Decile 7 | 7.58 |
| Decile 6 | 7.1 |
| Median | 6.65 |
| Decile 4 | 6.25 |
| Decile 3 | 5.85 |
| Decile 2 | 5.4 |
| Decile 1 | 4.83 |
| Minimum | 0 |
|

|
- Mean = 6.88516
- Std.dev = 2.12299
- 2094 items above graph maximum of 13.45
|
Instance 1 : First repeat assessment visit (2012-13)
19,389 participants, 19,389 items
| Maximum | 165.3 |
| Decile 9 | 8.9 |
| Decile 8 | 8 |
| Decile 7 | 7.4 |
| Decile 6 | 7 |
| Median | 6.6 |
| Decile 4 | 6.2 |
| Decile 3 | 5.8 |
| Decile 2 | 5.4 |
| Decile 1 | 4.82 |
| Minimum | 0 |
|

|
- Mean = 6.80608
- Std.dev = 2.38897
- 94 items above graph maximum of 12.98
|
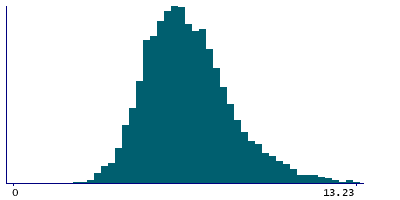
Instance 2 : Imaging visit (2014+)
5,855 participants, 5,855 items
| Maximum | 62.29 |
| Decile 9 | 9.03 |
| Decile 8 | 8.04 |
| Decile 7 | 7.47 |
| Decile 6 | 7.02 |
| Median | 6.57 |
| Decile 4 | 6.2 |
| Decile 3 | 5.79 |
| Decile 2 | 5.35 |
| Decile 1 | 4.83 |
| Minimum | 1.42 |
|
|
- Mean = 6.81126
- Std.dev = 1.96453
- 35 items above graph maximum of 13.23
|
Notes
Result of "White Blood Cell Count" assay, performed on blood sample, obtained from UK Biobank assessment centre visit. White blood count is the number of leukocytes.
Analyser operating range was 0 to 9x10^11 cells/Litre.
Typical reference range is 3.5x10^9 to 9.6x10^9 cells/Litre.
4 Related Data-Fields
| Field ID | Description | Relationship |
|---|
| 30004 | White blood cell (leukocyte) count a ... | Field 30004 is the data route used to acquire the result in Current Field |
| 30002 | White blood cell (leukocyte) count a ... | Field 30002 is the original acquisition time of the sample generating the result in Current Field. |
| 30003 | White blood cell (leukocyte) count d ... | Field 30003 is the ID of the device user to generate the result in Current Field |
| 30001 | White blood cell (leukocyte) count f ... | Field 30001 is the number of freeze-thaw cycles a sample underwent before generating the result in Current Field. |
1 Application
| Application ID | Title |
|---|
| 45925 | Risk Factors, Biomarkers and Impact of Major Vision-Threatening Eye Diseases |

