Data
87,996 items of data are available, covering 83,313 participants.
Defined-instances run from 2 to 3, labelled using Instancing
2.
Units of measurement are mm.
| Maximum | 3.947 |
| Decile 9 | 3.073 |
| Decile 8 | 2.97 |
| Decile 7 | 2.906 |
| Decile 6 | 2.857 |
| Median | 2.812 |
| Decile 4 | 2.767 |
| Decile 3 | 2.72 |
| Decile 2 | 2.663 |
| Decile 1 | 2.577 |
| Minimum | 1.26 |
|
|
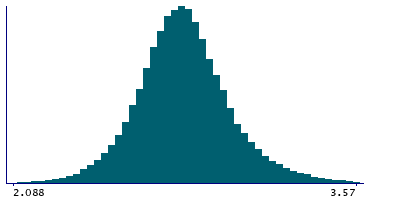
- Mean = 2.81967
- Std.dev = 0.205279
- 72 items below graph minimum of 2.081
- 160 items above graph maximum of 3.569
|
2 Instances
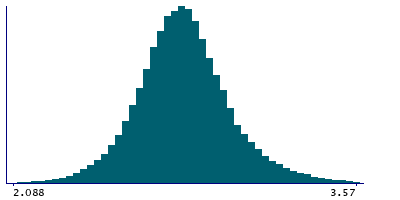
Instance 2 : Imaging visit (2014+)
83,241 participants, 83,241 items
| Maximum | 3.947 |
| Decile 9 | 3.072 |
| Decile 8 | 2.97 |
| Decile 7 | 2.906 |
| Decile 6 | 2.856 |
| Median | 2.812 |
| Decile 4 | 2.767 |
| Decile 3 | 2.72 |
| Decile 2 | 2.662 |
| Decile 1 | 2.576 |
| Minimum | 1.26 |
|
|
- Mean = 2.81922
- Std.dev = 0.205431
- 66 items below graph minimum of 2.08
- 153 items above graph maximum of 3.568
|
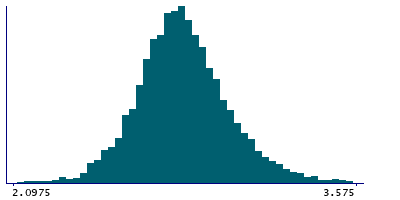
Instance 3 : First repeat imaging visit (2019+)
4,755 participants, 4,755 items
| Maximum | 3.754 |
| Decile 9 | 3.0825 |
| Decile 8 | 2.979 |
| Decile 7 | 2.912 |
| Decile 6 | 2.861 |
| Median | 2.817 |
| Decile 4 | 2.773 |
| Decile 3 | 2.726 |
| Decile 2 | 2.672 |
| Decile 1 | 2.59 |
| Minimum | 1.867 |
|
|
- Mean = 2.82756
- Std.dev = 0.202427
- 5 items below graph minimum of 2.0975
- 9 items above graph maximum of 3.575
|
Notes
Mean thickness of S-collat-transv-ant in the right hemisphere generated by parcellation of the white surface using Destrieux (a2009s) parcellation
0 Related Data-Fields
There are no related data-fields
0 Resources
There are no matching Resources
