Data
87,996 items of data are available, covering 83,313 participants.
Defined-instances run from 2 to 3, labelled using Instancing
2.
Units of measurement are mm.
| Maximum | 3.745 |
| Decile 9 | 3.231 |
| Decile 8 | 3.141 |
| Decile 7 | 3.07 |
| Decile 6 | 3.008 |
| Median | 2.946 |
| Decile 4 | 2.881 |
| Decile 3 | 2.805 |
| Decile 2 | 2.71 |
| Decile 1 | 2.5605 |
| Minimum | 1.067 |
|
|
- Mean = 2.91523
- Std.dev = 0.272046
- 186 items below graph minimum of 1.89
|
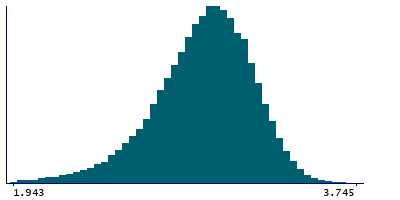
2 Instances
Instance 2 : Imaging visit (2014+)
83,241 participants, 83,241 items
| Maximum | 3.745 |
| Decile 9 | 3.23 |
| Decile 8 | 3.139 |
| Decile 7 | 3.069 |
| Decile 6 | 3.006 |
| Median | 2.945 |
| Decile 4 | 2.879 |
| Decile 3 | 2.802 |
| Decile 2 | 2.708 |
| Decile 1 | 2.557 |
| Minimum | 1.42 |
|

|
- Mean = 2.91331
- Std.dev = 0.272685
- 171 items below graph minimum of 1.884
|
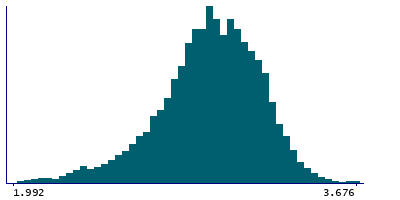
Instance 3 : First repeat imaging visit (2019+)
4,755 participants, 4,755 items
| Maximum | 3.676 |
| Decile 9 | 3.245 |
| Decile 8 | 3.164 |
| Decile 7 | 3.094 |
| Decile 6 | 3.033 |
| Median | 2.9715 |
| Decile 4 | 2.912 |
| Decile 3 | 2.848 |
| Decile 2 | 2.764 |
| Decile 1 | 2.6185 |
| Minimum | 1.067 |
|
|
- Mean = 2.94889
- Std.dev = 0.258295
- 14 items below graph minimum of 1.992
|
Notes
Mean thickness of G-precentral in the right hemisphere generated by parcellation of the white surface using Destrieux (a2009s) parcellation
0 Related Data-Fields
There are no related data-fields
0 Resources
There are no matching Resources
