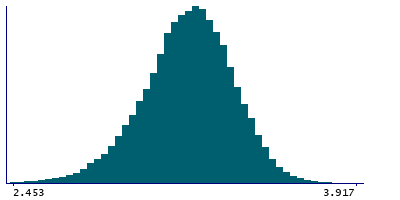
Data
87,996 items of data are available, covering 83,313 participants.
Defined-instances run from 2 to 3, labelled using Instancing
2.
Units of measurement are mm.
| Maximum | 3.961 |
| Decile 9 | 3.427 |
| Decile 8 | 3.35 |
| Decile 7 | 3.294 |
| Decile 6 | 3.2455 |
| Median | 3.199 |
| Decile 4 | 3.15 |
| Decile 3 | 3.098 |
| Decile 2 | 3.031 |
| Decile 1 | 2.931 |
| Minimum | 0.934 |
|
|
- Mean = 3.18556
- Std.dev = 0.202001
- 234 items below graph minimum of 2.435
- 2 items above graph maximum of 3.923
|
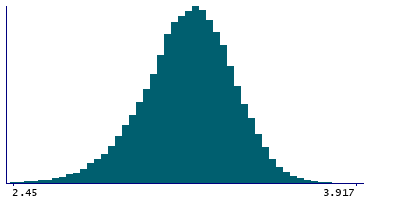
2 Instances
Instance 2 : Imaging visit (2014+)
83,241 participants, 83,241 items
| Maximum | 3.961 |
| Decile 9 | 3.426 |
| Decile 8 | 3.35 |
| Decile 7 | 3.293 |
| Decile 6 | 3.244 |
| Median | 3.197 |
| Decile 4 | 3.149 |
| Decile 3 | 3.096 |
| Decile 2 | 3.029 |
| Decile 1 | 2.929 |
| Minimum | 0.934 |
|
|
- Mean = 3.18425
- Std.dev = 0.202422
- 217 items below graph minimum of 2.432
- 2 items above graph maximum of 3.923
|
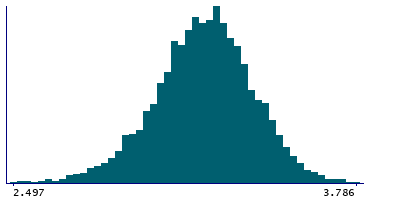
Instance 3 : First repeat imaging visit (2019+)
4,755 participants, 4,755 items
| Maximum | 3.786 |
| Decile 9 | 3.443 |
| Decile 8 | 3.364 |
| Decile 7 | 3.308 |
| Decile 6 | 3.262 |
| Median | 3.217 |
| Decile 4 | 3.172 |
| Decile 3 | 3.122 |
| Decile 2 | 3.063 |
| Decile 1 | 2.97 |
| Minimum | 1.538 |
|
|
- Mean = 3.20852
- Std.dev = 0.193032
- 14 items below graph minimum of 2.497
|
Notes
Mean thickness of G-cingul-Post-dorsal in the right hemisphere generated by parcellation of the white surface using Destrieux (a2009s) parcellation
0 Related Data-Fields
There are no related data-fields
0 Resources
There are no matching Resources
