Data
87,996 items of data are available, covering 83,313 participants.
Defined-instances run from 2 to 3, labelled using Instancing
2.
Units of measurement are mm.
| Maximum | 3.745 |
| Decile 9 | 3.067 |
| Decile 8 | 3 |
| Decile 7 | 2.954 |
| Decile 6 | 2.915 |
| Median | 2.878 |
| Decile 4 | 2.841 |
| Decile 3 | 2.801 |
| Decile 2 | 2.753 |
| Decile 1 | 2.684 |
| Minimum | 1.681 |
|

|
- Mean = 2.87641
- Std.dev = 0.153834
- 58 items below graph minimum of 2.301
- 44 items above graph maximum of 3.45
|
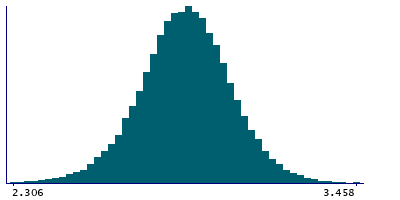
2 Instances
Instance 2 : Imaging visit (2014+)
83,241 participants, 83,241 items
| Maximum | 3.745 |
| Decile 9 | 3.067 |
| Decile 8 | 3 |
| Decile 7 | 2.954 |
| Decile 6 | 2.915 |
| Median | 2.878 |
| Decile 4 | 2.84 |
| Decile 3 | 2.801 |
| Decile 2 | 2.752 |
| Decile 1 | 2.683 |
| Minimum | 1.681 |
|
|
- Mean = 2.87606
- Std.dev = 0.154435
- 56 items below graph minimum of 2.299
- 41 items above graph maximum of 3.451
|
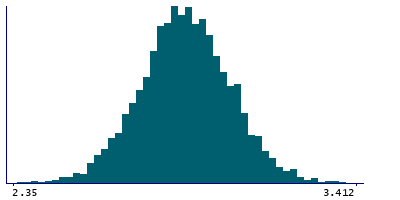
Instance 3 : First repeat imaging visit (2019+)
4,755 participants, 4,755 items
| Maximum | 3.481 |
| Decile 9 | 3.058 |
| Decile 8 | 2.998 |
| Decile 7 | 2.9535 |
| Decile 6 | 2.917 |
| Median | 2.882 |
| Decile 4 | 2.847 |
| Decile 3 | 2.811 |
| Decile 2 | 2.769 |
| Decile 1 | 2.704 |
| Minimum | 1.697 |
|
|
- Mean = 2.88239
- Std.dev = 0.142778
- 3 items below graph minimum of 2.35
- 7 items above graph maximum of 3.412
|
Notes
Mean thickness of G+S-cingul-Ant in the right hemisphere generated by parcellation of the white surface using Destrieux (a2009s) parcellation
0 Related Data-Fields
There are no related data-fields
0 Resources
There are no matching Resources
