Data
87,996 items of data are available, covering 83,313 participants.
Defined-instances run from 2 to 3, labelled using Instancing
2.
Units of measurement are mm.
| Maximum | 3.684 |
| Decile 9 | 3.122 |
| Decile 8 | 3.038 |
| Decile 7 | 2.979 |
| Decile 6 | 2.927 |
| Median | 2.878 |
| Decile 4 | 2.829 |
| Decile 3 | 2.774 |
| Decile 2 | 2.711 |
| Decile 1 | 2.619 |
| Minimum | 1.711 |
|

|
- Mean = 2.87317
- Std.dev = 0.198222
- 30 items below graph minimum of 2.116
- 10 items above graph maximum of 3.625
|
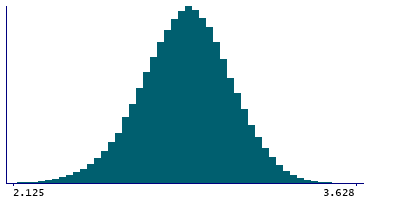
2 Instances
Instance 2 : Imaging visit (2014+)
83,241 participants, 83,241 items
| Maximum | 3.684 |
| Decile 9 | 3.122 |
| Decile 8 | 3.0375 |
| Decile 7 | 2.978 |
| Decile 6 | 2.926 |
| Median | 2.877 |
| Decile 4 | 2.828 |
| Decile 3 | 2.773 |
| Decile 2 | 2.71 |
| Decile 1 | 2.618 |
| Minimum | 1.711 |
|
|
- Mean = 2.8725
- Std.dev = 0.198476
- 26 items below graph minimum of 2.114
- 9 items above graph maximum of 3.626
|
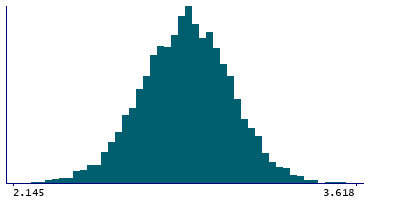
Instance 3 : First repeat imaging visit (2019+)
4,755 participants, 4,755 items
| Maximum | 3.628 |
| Decile 9 | 3.127 |
| Decile 8 | 3.048 |
| Decile 7 | 2.989 |
| Decile 6 | 2.934 |
| Median | 2.888 |
| Decile 4 | 2.842 |
| Decile 3 | 2.785 |
| Decile 2 | 2.725 |
| Decile 1 | 2.636 |
| Minimum | 1.933 |
|
|
- Mean = 2.88478
- Std.dev = 0.193343
- 3 items below graph minimum of 2.145
- 1 item above graph maximum of 3.618
|
Notes
Mean thickness of G+S-subcentral in the right hemisphere generated by parcellation of the white surface using Destrieux (a2009s) parcellation
0 Related Data-Fields
There are no related data-fields
0 Resources
There are no matching Resources
