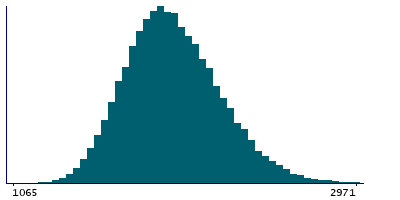
Data
87,996 items of data are available, covering 83,313 participants.
Defined-instances run from 2 to 3, labelled using Instancing
2.
Units of measurement are mm2.
| Maximum | 3489 |
| Decile 9 | 2284 |
| Decile 8 | 2151 |
| Decile 7 | 2062 |
| Decile 6 | 1985 |
| Median | 1918 |
| Decile 4 | 1854 |
| Decile 3 | 1788 |
| Decile 2 | 1714 |
| Decile 1 | 1615 |
| Minimum | 1051 |
|
|
- Mean = 1937.15
- Std.dev = 262.539
- 65 items above graph maximum of 2953
|
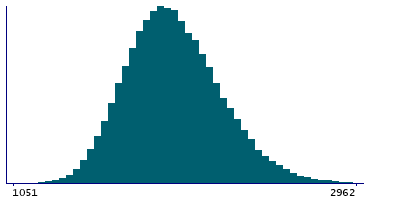
2 Instances
Instance 2 : Imaging visit (2014+)
83,241 participants, 83,241 items
| Maximum | 3489 |
| Decile 9 | 2284 |
| Decile 8 | 2150 |
| Decile 7 | 2061 |
| Decile 6 | 1984 |
| Median | 1917 |
| Decile 4 | 1853 |
| Decile 3 | 1787 |
| Decile 2 | 1713 |
| Decile 1 | 1614 |
| Minimum | 1051 |
|
|
- Mean = 1936.2
- Std.dev = 262.529
- 58 items above graph maximum of 2954
|
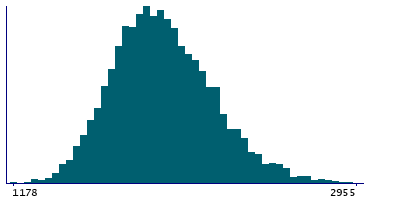
Instance 3 : First repeat imaging visit (2019+)
4,755 participants, 4,755 items
| Maximum | 3155 |
| Decile 9 | 2296.5 |
| Decile 8 | 2167 |
| Decile 7 | 2076 |
| Decile 6 | 1998 |
| Median | 1933 |
| Decile 4 | 1868 |
| Decile 3 | 1804 |
| Decile 2 | 1733 |
| Decile 1 | 1638 |
| Minimum | 1178 |
|
|
- Mean = 1953.78
- Std.dev = 262.159
- 7 items above graph maximum of 2955
|
Notes
Area of G-temporal-middle in the right hemisphere generated by parcellation of the white surface using Destrieux (a2009s) parcellation
0 Related Data-Fields
There are no related data-fields
0 Resources
There are no matching Resources
