Data
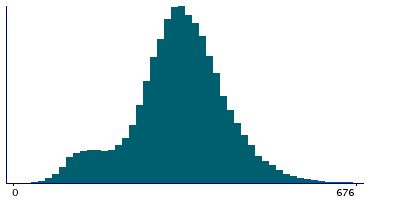
87,996 items of data are available, covering 83,313 participants.
Defined-instances run from 2 to 3, labelled using Instancing
2.
Units of measurement are mm2.
| Maximum | 914 |
| Decile 9 | 436 |
| Decile 8 | 396 |
| Decile 7 | 370 |
| Decile 6 | 348 |
| Median | 329 |
| Decile 4 | 309 |
| Decile 3 | 288 |
| Decile 2 | 260 |
| Decile 1 | 201 |
| Minimum | 9 |
|
|
- Mean = 325.155
- Std.dev = 92.4485
- 41 items above graph maximum of 671
|
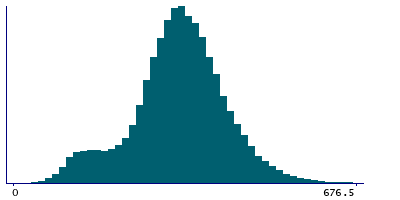
2 Instances
Instance 2 : Imaging visit (2014+)
83,241 participants, 83,241 items
| Maximum | 819 |
| Decile 9 | 436 |
| Decile 8 | 396 |
| Decile 7 | 370 |
| Decile 6 | 348 |
| Median | 329 |
| Decile 4 | 309 |
| Decile 3 | 288 |
| Decile 2 | 260 |
| Decile 1 | 201 |
| Minimum | 9 |
|
|
- Mean = 324.925
- Std.dev = 92.4809
- 36 items above graph maximum of 671
|
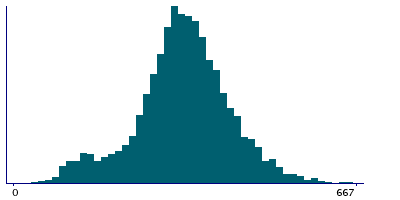
Instance 3 : First repeat imaging visit (2019+)
4,755 participants, 4,755 items
| Maximum | 914 |
| Decile 9 | 439 |
| Decile 8 | 399 |
| Decile 7 | 372 |
| Decile 6 | 351 |
| Median | 331 |
| Decile 4 | 313 |
| Decile 3 | 293 |
| Decile 2 | 265 |
| Decile 1 | 211 |
| Minimum | 50 |
|
|
- Mean = 329.185
- Std.dev = 91.7854
- 5 items above graph maximum of 667
|
Notes
Area of G-subcallosal in the right hemisphere generated by parcellation of the white surface using Destrieux (a2009s) parcellation
0 Related Data-Fields
There are no related data-fields
0 Resources
There are no matching Resources
