Data
87,996 items of data are available, covering 83,313 participants.
Defined-instances run from 2 to 3, labelled using Instancing
2.
Units of measurement are mm3.
| Maximum | 6160 |
| Decile 9 | 3918 |
| Decile 8 | 3662 |
| Decile 7 | 3485 |
| Decile 6 | 3345 |
| Median | 3219 |
| Decile 4 | 3101 |
| Decile 3 | 2978 |
| Decile 2 | 2843 |
| Decile 1 | 2666 |
| Minimum | 626 |
|
|
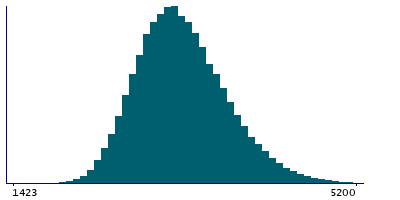
- Mean = 3263.18
- Std.dev = 496.172
- 3 items below graph minimum of 1414
- 100 items above graph maximum of 5170
|
2 Instances
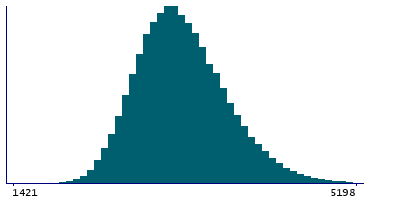
Instance 2 : Imaging visit (2014+)
83,241 participants, 83,241 items
| Maximum | 6160 |
| Decile 9 | 3916 |
| Decile 8 | 3659 |
| Decile 7 | 3483 |
| Decile 6 | 3343 |
| Median | 3217 |
| Decile 4 | 3098 |
| Decile 3 | 2976 |
| Decile 2 | 2841 |
| Decile 1 | 2664 |
| Minimum | 626 |
|
|
- Mean = 3260.87
- Std.dev = 496.16
- 2 items below graph minimum of 1412
- 99 items above graph maximum of 5168
|
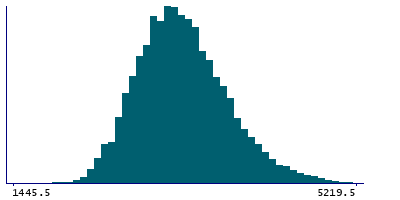
Instance 3 : First repeat imaging visit (2019+)
4,755 participants, 4,755 items
| Maximum | 5413 |
| Decile 9 | 3961.5 |
| Decile 8 | 3706 |
| Decile 7 | 3528 |
| Decile 6 | 3386 |
| Median | 3263.5 |
| Decile 4 | 3142 |
| Decile 3 | 3017 |
| Decile 2 | 2884 |
| Decile 1 | 2703.5 |
| Minimum | 1043 |
|
|
- Mean = 3303.63
- Std.dev = 494.628
- 1 item below graph minimum of 1445.5
- 2 items above graph maximum of 5219.5
|
Notes
Volume of G+S-subcentral in the left hemisphere generated by parcellation of the white surface using Destrieux (a2009s) parcellation
0 Related Data-Fields
There are no related data-fields
0 Resources
There are no matching Resources
