Data
87,996 items of data are available, covering 83,313 participants.
Defined-instances run from 2 to 3, labelled using Instancing
2.
Units of measurement are mm.
| Maximum | 4.719 |
| Decile 9 | 3.876 |
| Decile 8 | 3.767 |
| Decile 7 | 3.687 |
| Decile 6 | 3.615 |
| Median | 3.545 |
| Decile 4 | 3.472 |
| Decile 3 | 3.39 |
| Decile 2 | 3.293 |
| Decile 1 | 3.147 |
| Minimum | 1.694 |
|
|
- Mean = 3.52565
- Std.dev = 0.287058
- 48 items below graph minimum of 2.418
- 1 item above graph maximum of 4.605
|
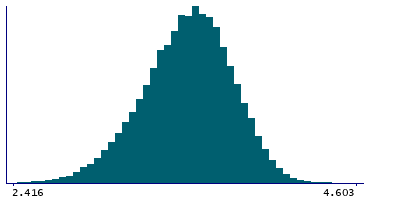
2 Instances
Instance 2 : Imaging visit (2014+)
83,241 participants, 83,241 items
| Maximum | 4.719 |
| Decile 9 | 3.876 |
| Decile 8 | 3.767 |
| Decile 7 | 3.687 |
| Decile 6 | 3.614 |
| Median | 3.545 |
| Decile 4 | 3.472 |
| Decile 3 | 3.389 |
| Decile 2 | 3.292 |
| Decile 1 | 3.146 |
| Minimum | 1.694 |
|

|
- Mean = 3.5252
- Std.dev = 0.287254
- 45 items below graph minimum of 2.416
- 1 item above graph maximum of 4.606
|
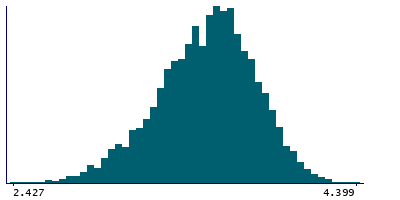
Instance 3 : First repeat imaging visit (2019+)
4,755 participants, 4,755 items
| Maximum | 4.399 |
| Decile 9 | 3.88 |
| Decile 8 | 3.773 |
| Decile 7 | 3.69 |
| Decile 6 | 3.625 |
| Median | 3.559 |
| Decile 4 | 3.48 |
| Decile 3 | 3.4 |
| Decile 2 | 3.305 |
| Decile 1 | 3.1535 |
| Minimum | 2.385 |
|
|
- Mean = 3.53357
- Std.dev = 0.283476
- 3 items below graph minimum of 2.427
|
Notes
Mean thickness of G-insular-short in the left hemisphere generated by parcellation of the white surface using Destrieux (a2009s) parcellation
0 Related Data-Fields
There are no related data-fields
0 Resources
There are no matching Resources
