Data
87,996 items of data are available, covering 83,313 participants.
Defined-instances run from 2 to 3, labelled using Instancing
2.
Units of measurement are mm.
| Maximum | 4.329 |
| Decile 9 | 3.469 |
| Decile 8 | 3.35 |
| Decile 7 | 3.262 |
| Decile 6 | 3.186 |
| Median | 3.115 |
| Decile 4 | 3.042 |
| Decile 3 | 2.962 |
| Decile 2 | 2.868 |
| Decile 1 | 2.737 |
| Minimum | 1.239 |
|

|
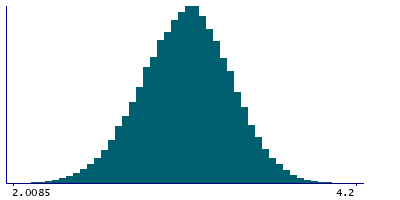
- Mean = 3.10778
- Std.dev = 0.286379
- 16 items below graph minimum of 2.005
- 8 items above graph maximum of 4.201
|
2 Instances
Instance 2 : Imaging visit (2014+)
83,241 participants, 83,241 items
| Maximum | 4.329 |
| Decile 9 | 3.469 |
| Decile 8 | 3.35 |
| Decile 7 | 3.262 |
| Decile 6 | 3.186 |
| Median | 3.116 |
| Decile 4 | 3.043 |
| Decile 3 | 2.962 |
| Decile 2 | 2.868 |
| Decile 1 | 2.737 |
| Minimum | 1.239 |
|
|
- Mean = 3.10802
- Std.dev = 0.286426
- 15 items below graph minimum of 2.005
- 8 items above graph maximum of 4.201
|
Instance 3 : First repeat imaging visit (2019+)
4,755 participants, 4,755 items
| Maximum | 4.052 |
| Decile 9 | 3.466 |
| Decile 8 | 3.35 |
| Decile 7 | 3.262 |
| Decile 6 | 3.185 |
| Median | 3.109 |
| Decile 4 | 3.035 |
| Decile 3 | 2.955 |
| Decile 2 | 2.869 |
| Decile 1 | 2.731 |
| Minimum | 1.995 |
|

|
- Mean = 3.10361
- Std.dev = 0.285538
- 1 item below graph minimum of 1.996
|
Notes
Mean thickness of G-Ins-lg+S-cent-ins in the left hemisphere generated by parcellation of the white surface using Destrieux (a2009s) parcellation
0 Related Data-Fields
There are no related data-fields
0 Resources
There are no matching Resources
