Data
87,996 items of data are available, covering 83,313 participants.
Defined-instances run from 2 to 3, labelled using Instancing
2.
Units of measurement are mm.
| Maximum | 2.923 |
| Decile 9 | 2.085 |
| Decile 8 | 2.017 |
| Decile 7 | 1.969 |
| Decile 6 | 1.928 |
| Median | 1.891 |
| Decile 4 | 1.853 |
| Decile 3 | 1.813 |
| Decile 2 | 1.765 |
| Decile 1 | 1.699 |
| Minimum | 1.273 |
|
|
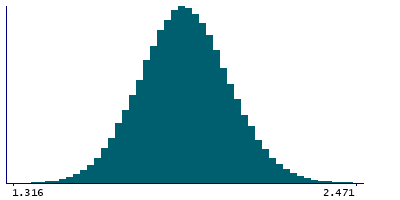
- Mean = 1.8918
- Std.dev = 0.151528
- 5 items below graph minimum of 1.313
- 31 items above graph maximum of 2.471
|
2 Instances
Instance 2 : Imaging visit (2014+)
83,241 participants, 83,241 items
| Maximum | 2.923 |
| Decile 9 | 2.084 |
| Decile 8 | 2.017 |
| Decile 7 | 1.969 |
| Decile 6 | 1.928 |
| Median | 1.89 |
| Decile 4 | 1.853 |
| Decile 3 | 1.812 |
| Decile 2 | 1.765 |
| Decile 1 | 1.699 |
| Minimum | 1.273 |
|

|
- Mean = 1.89153
- Std.dev = 0.151503
- 4 items below graph minimum of 1.314
- 31 items above graph maximum of 2.469
|
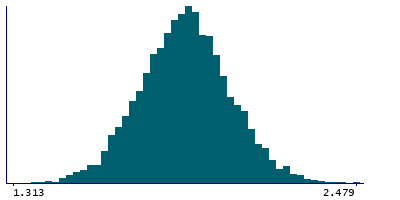
Instance 3 : First repeat imaging visit (2019+)
4,755 participants, 4,755 items
| Maximum | 2.479 |
| Decile 9 | 2.093 |
| Decile 8 | 2.021 |
| Decile 7 | 1.974 |
| Decile 6 | 1.932 |
| Median | 1.897 |
| Decile 4 | 1.86 |
| Decile 3 | 1.819 |
| Decile 2 | 1.77 |
| Decile 1 | 1.703 |
| Minimum | 1.295 |
|
|
- Mean = 1.89647
- Std.dev = 0.151899
- 1 item below graph minimum of 1.313
|
Notes
Mean thickness of G-cuneus in the left hemisphere generated by parcellation of the white surface using Destrieux (a2009s) parcellation
0 Related Data-Fields
There are no related data-fields
0 Resources
There are no matching Resources
