Data
87,996 items of data are available, covering 83,313 participants.
Defined-instances run from 2 to 3, labelled using Instancing
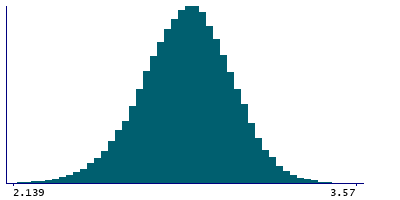
2.
Units of measurement are mm.
| Maximum | 3.651 |
| Decile 9 | 3.089 |
| Decile 8 | 3.011 |
| Decile 7 | 2.954 |
| Decile 6 | 2.905 |
| Median | 2.859 |
| Decile 4 | 2.811 |
| Decile 3 | 2.759 |
| Decile 2 | 2.697 |
| Decile 1 | 2.607 |
| Minimum | 1.622 |
|
|
- Mean = 2.85172
- Std.dev = 0.190793
- 78 items below graph minimum of 2.125
- 2 items above graph maximum of 3.571
|
2 Instances
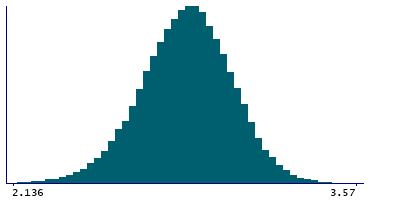
Instance 2 : Imaging visit (2014+)
83,241 participants, 83,241 items
| Maximum | 3.651 |
| Decile 9 | 3.088 |
| Decile 8 | 3.01 |
| Decile 7 | 2.953 |
| Decile 6 | 2.904 |
| Median | 2.857 |
| Decile 4 | 2.81 |
| Decile 3 | 2.757 |
| Decile 2 | 2.695 |
| Decile 1 | 2.605 |
| Minimum | 1.622 |
|
|
- Mean = 2.85038
- Std.dev = 0.191283
- 69 items below graph minimum of 2.122
- 2 items above graph maximum of 3.571
|
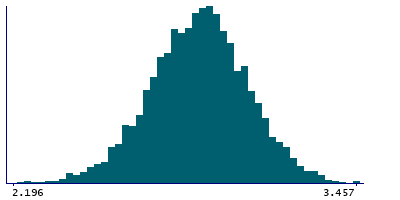
Instance 3 : First repeat imaging visit (2019+)
4,755 participants, 4,755 items
| Maximum | 3.457 |
| Decile 9 | 3.1 |
| Decile 8 | 3.027 |
| Decile 7 | 2.968 |
| Decile 6 | 2.924 |
| Median | 2.881 |
| Decile 4 | 2.836 |
| Decile 3 | 2.786 |
| Decile 2 | 2.73 |
| Decile 1 | 2.648 |
| Minimum | 1.765 |
|
|
- Mean = 2.87512
- Std.dev = 0.180402
- 6 items below graph minimum of 2.196
|
Notes
Mean thickness of parsorbitalis in the right hemisphere generated by parcellation of the white surface using DKT parcellation
0 Related Data-Fields
There are no related data-fields
0 Resources
There are no matching Resources
