Data
87,996 items of data are available, covering 83,313 participants.
Defined-instances run from 2 to 3, labelled using Instancing
2.
Units of measurement are mm.
| Maximum | 3.691 |
| Decile 9 | 3.148 |
| Decile 8 | 3.086 |
| Decile 7 | 3.04 |
| Decile 6 | 3 |
| Median | 2.962 |
| Decile 4 | 2.923 |
| Decile 3 | 2.881 |
| Decile 2 | 2.83 |
| Decile 1 | 2.757 |
| Minimum | 1.724 |
|
|
- Mean = 2.95648
- Std.dev = 0.153566
- 47 items below graph minimum of 2.366
- 1 item above graph maximum of 3.539
|
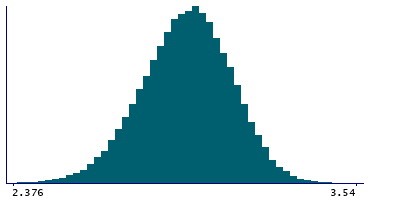
2 Instances
Instance 2 : Imaging visit (2014+)
83,241 participants, 83,241 items
| Maximum | 3.691 |
| Decile 9 | 3.147 |
| Decile 8 | 3.086 |
| Decile 7 | 3.04 |
| Decile 6 | 3 |
| Median | 2.961 |
| Decile 4 | 2.922 |
| Decile 3 | 2.88 |
| Decile 2 | 2.828 |
| Decile 1 | 2.756 |
| Minimum | 1.966 |
|

|
- Mean = 2.95569
- Std.dev = 0.15374
- 42 items below graph minimum of 2.365
- 1 item above graph maximum of 3.538
|
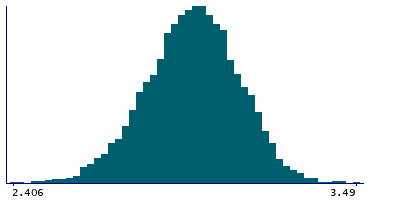
Instance 3 : First repeat imaging visit (2019+)
4,755 participants, 4,755 items
| Maximum | 3.49 |
| Decile 9 | 3.156 |
| Decile 8 | 3.094 |
| Decile 7 | 3.051 |
| Decile 6 | 3.011 |
| Median | 2.976 |
| Decile 4 | 2.938 |
| Decile 3 | 2.899 |
| Decile 2 | 2.848 |
| Decile 1 | 2.781 |
| Minimum | 1.724 |
|
|
- Mean = 2.97029
- Std.dev = 0.149821
- 5 items below graph minimum of 2.406
|
Notes
Mean thickness of middletemporal in the right hemisphere generated by parcellation of the white surface using DKT parcellation
0 Related Data-Fields
There are no related data-fields
0 Resources
There are no matching Resources
