Data
87,996 items of data are available, covering 83,313 participants.
Defined-instances run from 2 to 3, labelled using Instancing
2.
Units of measurement are mm.
| Maximum | 2.63 |
| Decile 9 | 2.193 |
| Decile 8 | 2.129 |
| Decile 7 | 2.081 |
| Decile 6 | 2.041 |
| Median | 2.003 |
| Decile 4 | 1.965 |
| Decile 3 | 1.924 |
| Decile 2 | 1.875 |
| Decile 1 | 1.807 |
| Minimum | 1.326 |
|

|
- Mean = 2.00145
- Std.dev = 0.151357
- 13 items below graph minimum of 1.421
- 4 items above graph maximum of 2.579
|
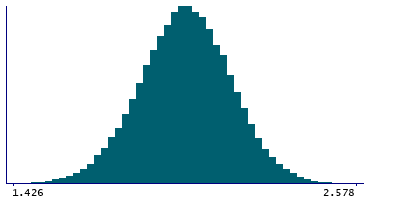
2 Instances
Instance 2 : Imaging visit (2014+)
83,241 participants, 83,241 items
| Maximum | 2.63 |
| Decile 9 | 2.192 |
| Decile 8 | 2.128 |
| Decile 7 | 2.081 |
| Decile 6 | 2.04 |
| Median | 2.003 |
| Decile 4 | 1.965 |
| Decile 3 | 1.924 |
| Decile 2 | 1.874 |
| Decile 1 | 1.806 |
| Minimum | 1.326 |
|
|
- Mean = 2.00074
- Std.dev = 0.151363
- 13 items below graph minimum of 1.42
- 4 items above graph maximum of 2.578
|
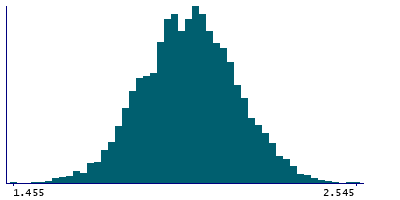
Instance 3 : First repeat imaging visit (2019+)
4,755 participants, 4,755 items
| Maximum | 2.545 |
| Decile 9 | 2.21 |
| Decile 8 | 2.14 |
| Decile 7 | 2.093 |
| Decile 6 | 2.052 |
| Median | 2.015 |
| Decile 4 | 1.974 |
| Decile 3 | 1.936 |
| Decile 2 | 1.886 |
| Decile 1 | 1.8215 |
| Minimum | 1.455 |
|
|
- Mean = 2.01382
- Std.dev = 0.150719
|
Notes
Mean thickness of lingual in the right hemisphere generated by parcellation of the white surface using DKT parcellation
0 Related Data-Fields
There are no related data-fields
0 Resources
There are no matching Resources
