Data
87,996 items of data are available, covering 83,313 participants.
Defined-instances run from 2 to 3, labelled using Instancing
2.
Units of measurement are mm2.
| Maximum | 2564 |
| Decile 9 | 1712 |
| Decile 8 | 1587 |
| Decile 7 | 1501 |
| Decile 6 | 1430 |
| Median | 1366 |
| Decile 4 | 1304 |
| Decile 3 | 1242 |
| Decile 2 | 1173 |
| Decile 1 | 1083 |
| Minimum | 534 |
|

|
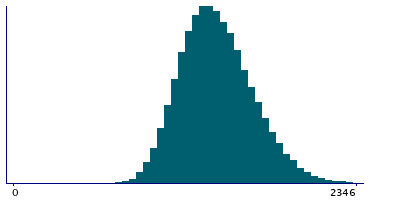
- Mean = 1384.5
- Std.dev = 245.186
- 37 items above graph maximum of 2341
|
2 Instances
Instance 2 : Imaging visit (2014+)
83,241 participants, 83,241 items
| Maximum | 2564 |
| Decile 9 | 1712 |
| Decile 8 | 1587 |
| Decile 7 | 1500 |
| Decile 6 | 1430 |
| Median | 1365 |
| Decile 4 | 1304 |
| Decile 3 | 1241 |
| Decile 2 | 1173 |
| Decile 1 | 1082 |
| Minimum | 584 |
|
|
- Mean = 1383.88
- Std.dev = 245.259
- 35 items above graph maximum of 2342
|
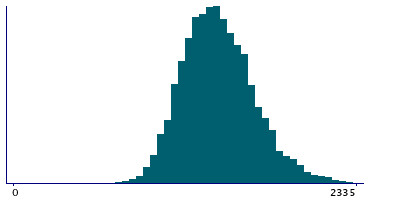
Instance 3 : First repeat imaging visit (2019+)
4,755 participants, 4,755 items
| Maximum | 2549 |
| Decile 9 | 1718.5 |
| Decile 8 | 1590 |
| Decile 7 | 1510 |
| Decile 6 | 1439 |
| Median | 1377 |
| Decile 4 | 1317 |
| Decile 3 | 1254 |
| Decile 2 | 1189 |
| Decile 1 | 1102 |
| Minimum | 534 |
|
|
- Mean = 1395.31
- Std.dev = 243.638
- 2 items above graph maximum of 2335
|
Notes
Area of pericalcarine in the left hemisphere generated by parcellation of the white surface using DKT parcellation
0 Related Data-Fields
There are no related data-fields
0 Resources
There are no matching Resources
