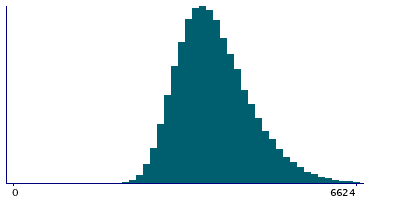
Data
87,996 items of data are available, covering 83,313 participants.
Defined-instances run from 2 to 3, labelled using Instancing
2.
Units of measurement are mm3.
| Maximum | 7793 |
| Decile 9 | 4778 |
| Decile 8 | 4389 |
| Decile 7 | 4133 |
| Decile 6 | 3930 |
| Median | 3751 |
| Decile 4 | 3585 |
| Decile 3 | 3420 |
| Decile 2 | 3238 |
| Decile 1 | 3013 |
| Minimum | 1491 |
|
|
- Mean = 3835.2
- Std.dev = 700.506
- 118 items above graph maximum of 6543
|
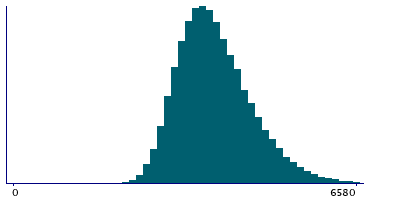
2 Instances
Instance 2 : Imaging visit (2014+)
83,241 participants, 83,241 items
| Maximum | 7793 |
| Decile 9 | 4776 |
| Decile 8 | 4388 |
| Decile 7 | 4131 |
| Decile 6 | 3928 |
| Median | 3749 |
| Decile 4 | 3583 |
| Decile 3 | 3418 |
| Decile 2 | 3236 |
| Decile 1 | 3011 |
| Minimum | 1491 |
|
|
- Mean = 3833.49
- Std.dev = 700.521
- 111 items above graph maximum of 6541
|
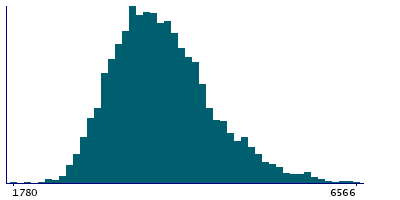
Instance 3 : First repeat imaging visit (2019+)
4,755 participants, 4,755 items
| Maximum | 7255 |
| Decile 9 | 4805.5 |
| Decile 8 | 4395 |
| Decile 7 | 4162.5 |
| Decile 6 | 3962 |
| Median | 3787 |
| Decile 4 | 3620 |
| Decile 3 | 3449 |
| Decile 2 | 3264 |
| Decile 1 | 3045 |
| Minimum | 1780 |
|
|
- Mean = 3865.06
- Std.dev = 699.566
- 7 items above graph maximum of 6566
|
Notes
Volume of MT in the right hemisphere generated by parcellation of the white surface using BA_exvivo parcellation
0 Related Data-Fields
There are no related data-fields
0 Resources
There are no matching Resources
