Data
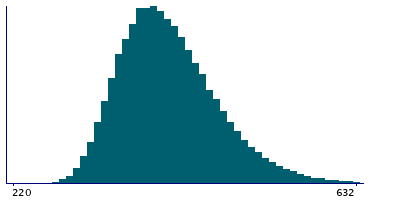
87,996 items of data are available, covering 83,313 participants.
Defined-instances run from 2 to 3, labelled using Instancing
2.
Units of measurement are mm2.
| Maximum | 940 |
| Decile 9 | 484 |
| Decile 8 | 452 |
| Decile 7 | 431 |
| Decile 6 | 414 |
| Median | 399 |
| Decile 4 | 385 |
| Decile 3 | 371 |
| Decile 2 | 356 |
| Decile 1 | 337 |
| Minimum | 220 |
|
|
- Mean = 405.724
- Std.dev = 58.3111
- 101 items above graph maximum of 631
|
2 Instances
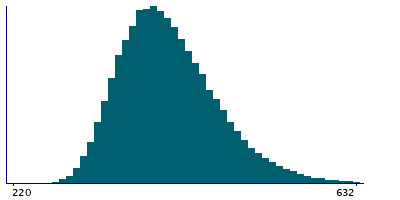
Instance 2 : Imaging visit (2014+)
83,241 participants, 83,241 items
| Maximum | 940 |
| Decile 9 | 484 |
| Decile 8 | 452 |
| Decile 7 | 431 |
| Decile 6 | 414 |
| Median | 399 |
| Decile 4 | 385 |
| Decile 3 | 371 |
| Decile 2 | 356 |
| Decile 1 | 337 |
| Minimum | 220 |
|
|
- Mean = 405.67
- Std.dev = 58.2996
- 97 items above graph maximum of 631
|
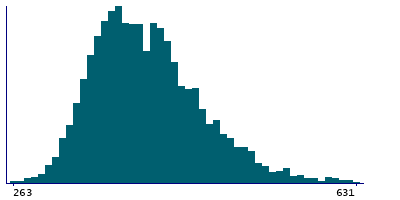
Instance 3 : First repeat imaging visit (2019+)
4,755 participants, 4,755 items
| Maximum | 648 |
| Decile 9 | 485 |
| Decile 8 | 453 |
| Decile 7 | 431 |
| Decile 6 | 415 |
| Median | 399 |
| Decile 4 | 385 |
| Decile 3 | 371 |
| Decile 2 | 357 |
| Decile 1 | 339 |
| Minimum | 263 |
|
|
- Mean = 406.675
- Std.dev = 58.5045
- 4 items above graph maximum of 631
|
Notes
Area of perirhinal in the right hemisphere generated by parcellation of the white surface using BA_exvivo parcellation
0 Related Data-Fields
There are no related data-fields
0 Resources
There are no matching Resources
