Data
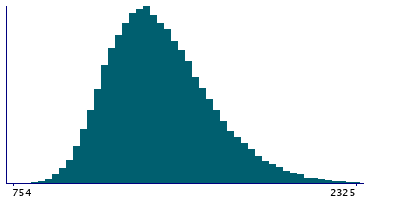
87,996 items of data are available, covering 83,313 participants.
Defined-instances run from 2 to 3, labelled using Instancing
2.
Units of measurement are mm2.
| Maximum | 2819 |
| Decile 9 | 1731 |
| Decile 8 | 1605 |
| Decile 7 | 1521 |
| Decile 6 | 1454 |
| Median | 1394 |
| Decile 4 | 1339 |
| Decile 3 | 1283 |
| Decile 2 | 1222 |
| Decile 1 | 1146 |
| Minimum | 754 |
|
|
- Mean = 1420.23
- Std.dev = 231.132
- 90 items above graph maximum of 2316
|
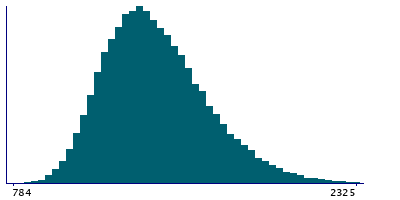
2 Instances
Instance 2 : Imaging visit (2014+)
83,241 participants, 83,241 items
| Maximum | 2819 |
| Decile 9 | 1731 |
| Decile 8 | 1605 |
| Decile 7 | 1521 |
| Decile 6 | 1453 |
| Median | 1393 |
| Decile 4 | 1338 |
| Decile 3 | 1283 |
| Decile 2 | 1222 |
| Decile 1 | 1146 |
| Minimum | 755 |
|
|
- Mean = 1420.02
- Std.dev = 231.303
- 86 items above graph maximum of 2316
|
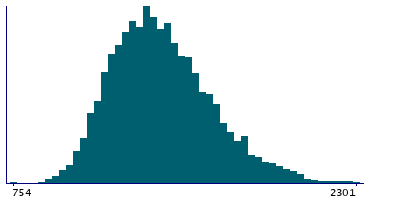
Instance 3 : First repeat imaging visit (2019+)
4,755 participants, 4,755 items
| Maximum | 2439 |
| Decile 9 | 1727.5 |
| Decile 8 | 1607 |
| Decile 7 | 1525 |
| Decile 6 | 1457 |
| Median | 1399 |
| Decile 4 | 1346 |
| Decile 3 | 1288 |
| Decile 2 | 1228 |
| Decile 1 | 1154 |
| Minimum | 754 |
|
|
- Mean = 1424
- Std.dev = 228.086
- 6 items above graph maximum of 2301
|
Notes
Area of MT in the right hemisphere generated by parcellation of the white surface using BA_exvivo parcellation
0 Related Data-Fields
There are no related data-fields
0 Resources
There are no matching Resources
