Data
87,996 items of data are available, covering 83,313 participants.
Defined-instances run from 2 to 3, labelled using Instancing
2.
Units of measurement are AU.
| Maximum | 35.2175 |
| Decile 9 | 29.6812 |
| Decile 8 | 28.9327 |
| Decile 7 | 28.3731 |
| Decile 6 | 27.877 |
| Median | 27.3991 |
| Decile 4 | 26.8965 |
| Decile 3 | 26.3357 |
| Decile 2 | 25.6334 |
| Decile 1 | 24.5609 |
| Minimum | 15.4043 |
|
|
- Mean = 27.235
- Std.dev = 2.04752
- 107 items below graph minimum of 19.4406
- 1 item above graph maximum of 34.8015
|
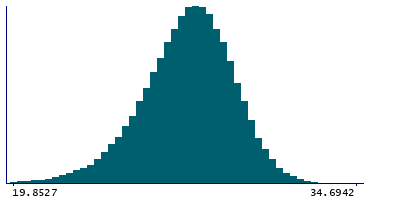
2 Instances
Instance 2 : Imaging visit (2014+)
83,241 participants, 83,241 items
| Maximum | 35.2175 |
| Decile 9 | 29.676 |
| Decile 8 | 28.9263 |
| Decile 7 | 28.3636 |
| Decile 6 | 27.8638 |
| Median | 27.3844 |
| Decile 4 | 26.8786 |
| Decile 3 | 26.314 |
| Decile 2 | 25.6089 |
| Decile 1 | 24.541 |
| Minimum | 15.4043 |
|

|
- Mean = 27.2204
- Std.dev = 2.0545
- 100 items below graph minimum of 19.4061
- 1 item above graph maximum of 34.8109
|
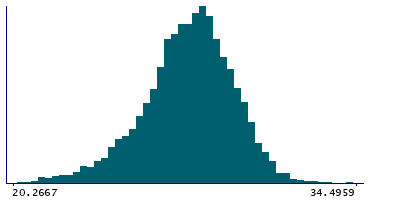
Instance 3 : First repeat imaging visit (2019+)
4,755 participants, 4,755 items
| Maximum | 34.6609 |
| Decile 9 | 29.7528 |
| Decile 8 | 29.0518 |
| Decile 7 | 28.5119 |
| Decile 6 | 28.0905 |
| Median | 27.6542 |
| Decile 4 | 27.1835 |
| Decile 3 | 26.6964 |
| Decile 2 | 26.0901 |
| Decile 1 | 25.0098 |
| Minimum | 17.4728 |
|
|
- Mean = 27.4905
- Std.dev = 1.90308
- 10 items below graph minimum of 20.2667
- 1 item above graph maximum of 34.4959
|
Notes
Grey-white contrast in inferiorparietal in the right hemisphere calculated as a percentage of the mean gray-white matter intensity from Desikan-Killiany parcellation
0 Related Data-Fields
There are no related data-fields
0 Resources
There are no matching Resources
