Data
87,996 items of data are available, covering 83,313 participants.
Defined-instances run from 2 to 3, labelled using Instancing
2.
Units of measurement are AU.
| Maximum | 36.8847 |
| Decile 9 | 29.5309 |
| Decile 8 | 28.7777 |
| Decile 7 | 28.2253 |
| Decile 6 | 27.7285 |
| Median | 27.2559 |
| Decile 4 | 26.7584 |
| Decile 3 | 26.1867 |
| Decile 2 | 25.4789 |
| Decile 1 | 24.4124 |
| Minimum | 15.0864 |
|
|
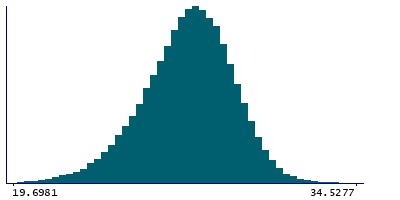
- Mean = 27.0913
- Std.dev = 2.03986
- 95 items below graph minimum of 19.294
- 9 items above graph maximum of 34.6494
|
2 Instances
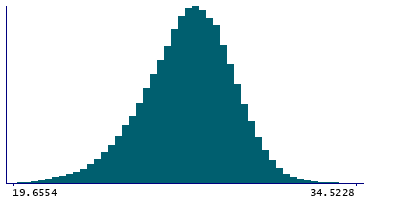
Instance 2 : Imaging visit (2014+)
83,241 participants, 83,241 items
| Maximum | 36.8847 |
| Decile 9 | 29.5114 |
| Decile 8 | 28.7552 |
| Decile 7 | 28.2028 |
| Decile 6 | 27.7034 |
| Median | 27.2282 |
| Decile 4 | 26.7314 |
| Decile 3 | 26.1579 |
| Decile 2 | 25.4524 |
| Decile 1 | 24.3863 |
| Minimum | 15.0864 |
|
|
- Mean = 27.0652
- Std.dev = 2.0427
- 90 items below graph minimum of 19.2612
- 8 items above graph maximum of 34.6365
|
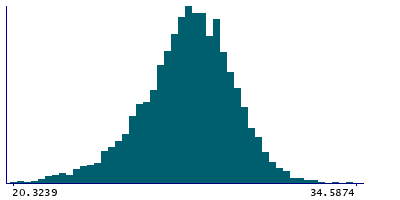
Instance 3 : First repeat imaging visit (2019+)
4,755 participants, 4,755 items
| Maximum | 35.7733 |
| Decile 9 | 29.8329 |
| Decile 8 | 29.1042 |
| Decile 7 | 28.62 |
| Decile 6 | 28.1316 |
| Median | 27.6902 |
| Decile 4 | 27.2554 |
| Decile 3 | 26.7456 |
| Decile 2 | 26.0636 |
| Decile 1 | 25.0784 |
| Minimum | 15.6502 |
|
|
- Mean = 27.5478
- Std.dev = 1.93328
- 5 items below graph minimum of 20.3239
- 1 item above graph maximum of 34.5874
|
Notes
Grey-white contrast in fusiform in the right hemisphere calculated as a percentage of the mean gray-white matter intensity from Desikan-Killiany parcellation
0 Related Data-Fields
There are no related data-fields
0 Resources
There are no matching Resources
