Data
87,996 items of data are available, covering 83,313 participants.
Defined-instances run from 2 to 3, labelled using Instancing
2.
Units of measurement are mm.
| Maximum | 3.437 |
| Decile 9 | 2.883 |
| Decile 8 | 2.804 |
| Decile 7 | 2.744 |
| Decile 6 | 2.692 |
| Median | 2.641 |
| Decile 4 | 2.589 |
| Decile 3 | 2.531 |
| Decile 2 | 2.461 |
| Decile 1 | 2.356 |
| Minimum | 1.576 |
|
|
- Mean = 2.62925
- Std.dev = 0.206028
- 36 items below graph minimum of 1.829
- 1 item above graph maximum of 3.41
|
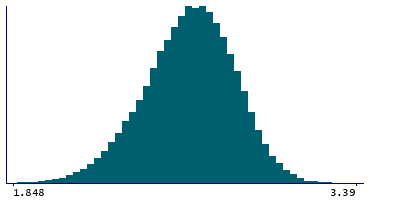
2 Instances
Instance 2 : Imaging visit (2014+)
83,241 participants, 83,241 items
| Maximum | 3.437 |
| Decile 9 | 2.883 |
| Decile 8 | 2.803 |
| Decile 7 | 2.744 |
| Decile 6 | 2.691 |
| Median | 2.64 |
| Decile 4 | 2.588 |
| Decile 3 | 2.53 |
| Decile 2 | 2.46 |
| Decile 1 | 2.355 |
| Minimum | 1.576 |
|

|
- Mean = 2.62864
- Std.dev = 0.206352
- 35 items below graph minimum of 1.827
- 1 item above graph maximum of 3.411
|
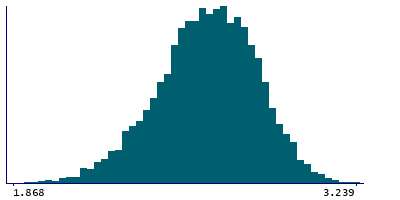
Instance 3 : First repeat imaging visit (2019+)
4,755 participants, 4,755 items
| Maximum | 3.239 |
| Decile 9 | 2.884 |
| Decile 8 | 2.811 |
| Decile 7 | 2.756 |
| Decile 6 | 2.702 |
| Median | 2.651 |
| Decile 4 | 2.6 |
| Decile 3 | 2.544 |
| Decile 2 | 2.479 |
| Decile 1 | 2.376 |
| Minimum | 1.758 |
|
|
- Mean = 2.64002
- Std.dev = 0.199963
- 6 items below graph minimum of 1.868
|
Notes
Mean thickness of paracentral in the right hemisphere generated by parcellation of the white surface using Desikan-Killiany parcellation
0 Related Data-Fields
There are no related data-fields
0 Resources
There are no matching Resources
