Data
87,996 items of data are available, covering 83,313 participants.
Defined-instances run from 2 to 3, labelled using Instancing
2.
Units of measurement are mm2.
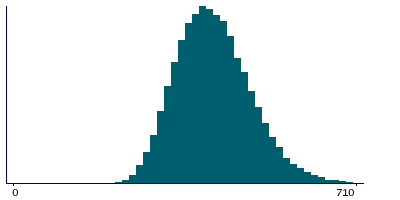
| Maximum | 1234 |
| Decile 9 | 513 |
| Decile 8 | 475 |
| Decile 7 | 448 |
| Decile 6 | 427 |
| Median | 407 |
| Decile 4 | 388 |
| Decile 3 | 368 |
| Decile 2 | 347 |
| Decile 1 | 319 |
| Minimum | 74 |
|
|
- Mean = 412.852
- Std.dev = 76.8679
- 127 items above graph maximum of 707
|
2 Instances
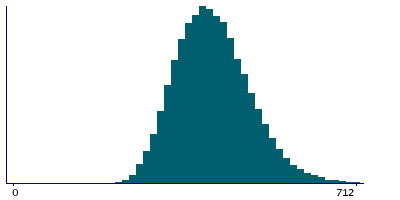
Instance 2 : Imaging visit (2014+)
83,241 participants, 83,241 items
| Maximum | 1234 |
| Decile 9 | 513 |
| Decile 8 | 475 |
| Decile 7 | 448 |
| Decile 6 | 427 |
| Median | 407 |
| Decile 4 | 388 |
| Decile 3 | 368 |
| Decile 2 | 347 |
| Decile 1 | 319 |
| Minimum | 74 |
|
|
- Mean = 412.859
- Std.dev = 76.8483
- 121 items above graph maximum of 707
|
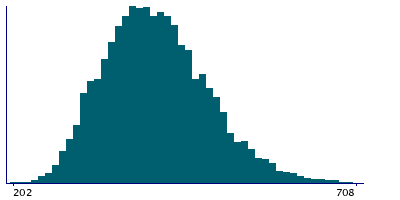
Instance 3 : First repeat imaging visit (2019+)
4,755 participants, 4,755 items
| Maximum | 788 |
| Decile 9 | 512 |
| Decile 8 | 476 |
| Decile 7 | 448 |
| Decile 6 | 427 |
| Median | 407 |
| Decile 4 | 387 |
| Decile 3 | 368 |
| Decile 2 | 346 |
| Decile 1 | 316 |
| Minimum | 202 |
|
|
- Mean = 412.739
- Std.dev = 77.2089
- 6 items above graph maximum of 708
|
Notes
Area of entorhinal in the right hemisphere generated by parcellation of the white surface using Desikan-Killiany parcellation
0 Related Data-Fields
There are no related data-fields
0 Resources
There are no matching Resources
