Data
87,996 items of data are available, covering 83,313 participants.
Defined-instances run from 2 to 3, labelled using Instancing
2.
Units of measurement are mm3.
| Maximum | 325.317 |
| Decile 9 | 128.393 |
| Decile 8 | 119.254 |
| Decile 7 | 112.986 |
| Decile 6 | 107.894 |
| Median | 103.211 |
| Decile 4 | 98.6807 |
| Decile 3 | 94.0903 |
| Decile 2 | 88.8703 |
| Decile 1 | 82.0508 |
| Minimum | 1.23877 |
|

|
- Mean = 104.452
- Std.dev = 18.3515
- 79 items above graph maximum of 174.736
|
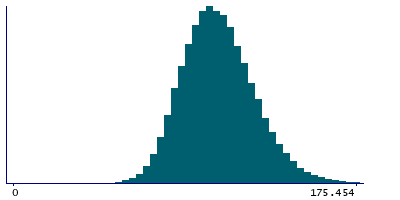
2 Instances
Instance 2 : Imaging visit (2014+)
83,241 participants, 83,241 items
| Maximum | 325.317 |
| Decile 9 | 128.286 |
| Decile 8 | 119.184 |
| Decile 7 | 112.934 |
| Decile 6 | 107.829 |
| Median | 103.153 |
| Decile 4 | 98.6278 |
| Decile 3 | 94.0328 |
| Decile 2 | 88.8068 |
| Decile 1 | 81.9797 |
| Minimum | 1.23877 |
|
|
- Mean = 104.387
- Std.dev = 18.3585
- 79 items above graph maximum of 174.593
|
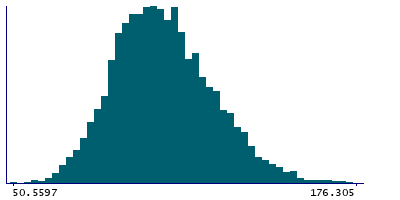
Instance 3 : First repeat imaging visit (2019+)
4,755 participants, 4,755 items
| Maximum | 184.951 |
| Decile 9 | 129.978 |
| Decile 8 | 120.696 |
| Decile 7 | 113.976 |
| Decile 6 | 108.911 |
| Median | 104.13 |
| Decile 4 | 99.6209 |
| Decile 3 | 94.9952 |
| Decile 2 | 90.0336 |
| Decile 1 | 83.6514 |
| Minimum | 50.5597 |
|
|
- Mean = 105.592
- Std.dev = 18.1903
- 1 item above graph maximum of 176.305
|
Notes
Volume of LP in the right hemisphere generated by subcortical volumetric sub-segmentation of the Thalamic Nuclei
0 Related Data-Fields
There are no related data-fields
0 Resources
There are no matching Resources
