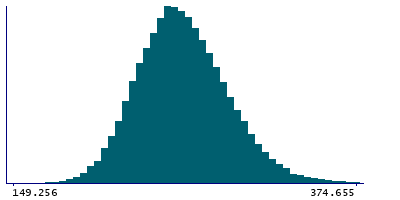
Data
87,996 items of data are available, covering 83,313 participants.
Defined-instances run from 2 to 3, labelled using Instancing
2.
Units of measurement are mm3.
| Maximum | 727.861 |
| Decile 9 | 297.152 |
| Decile 8 | 282.505 |
| Decile 7 | 272.362 |
| Decile 6 | 264.083 |
| Median | 256.565 |
| Decile 4 | 249.385 |
| Decile 3 | 241.912 |
| Decile 2 | 233.313 |
| Decile 1 | 222.112 |
| Minimum | 124.308 |
|
|
- Mean = 258.589
- Std.dev = 30.326
- 13 items below graph minimum of 147.072
- 185 items above graph maximum of 372.191
|
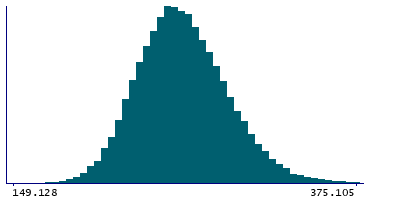
2 Instances
Instance 2 : Imaging visit (2014+)
83,241 participants, 83,241 items
| Maximum | 727.861 |
| Decile 9 | 297.118 |
| Decile 8 | 282.444 |
| Decile 7 | 272.291 |
| Decile 6 | 264.045 |
| Median | 256.502 |
| Decile 4 | 249.288 |
| Decile 3 | 241.803 |
| Decile 2 | 233.22 |
| Decile 1 | 221.998 |
| Minimum | 124.308 |
|
|
- Mean = 258.511
- Std.dev = 30.3263
- 12 items below graph minimum of 146.879
- 174 items above graph maximum of 372.238
|
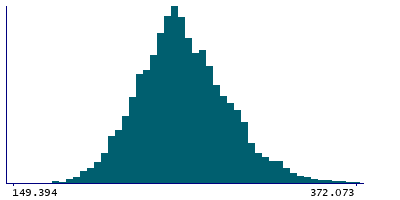
Instance 3 : First repeat imaging visit (2019+)
4,755 participants, 4,755 items
| Maximum | 534.514 |
| Decile 9 | 297.831 |
| Decile 8 | 283.749 |
| Decile 7 | 273.385 |
| Decile 6 | 264.81 |
| Median | 257.678 |
| Decile 4 | 251.197 |
| Decile 3 | 244.306 |
| Decile 2 | 235.483 |
| Decile 1 | 223.62 |
| Minimum | 141.048 |
|
|
- Mean = 259.961
- Std.dev = 30.2891
- 1 item below graph minimum of 149.41
- 12 items above graph maximum of 372.041
|
Notes
Volume of MDl in the right hemisphere generated by subcortical volumetric sub-segmentation of the Thalamic Nuclei
0 Related Data-Fields
There are no related data-fields
0 Resources
There are no matching Resources
