Data
87,996 items of data are available, covering 83,313 participants.
Defined-instances run from 2 to 3, labelled using Instancing
2.
Units of measurement are mm3.
| Maximum | 610.062 |
| Decile 9 | 134.241 |
| Decile 8 | 126.645 |
| Decile 7 | 121.326 |
| Decile 6 | 116.893 |
| Median | 112.866 |
| Decile 4 | 108.925 |
| Decile 3 | 104.734 |
| Decile 2 | 99.9151 |
| Decile 1 | 93.3694 |
| Minimum | 18.3134 |
|
|
- Mean = 113.458
- Std.dev = 16.3894
- 11 items below graph minimum of 52.4974
- 66 items above graph maximum of 175.113
|
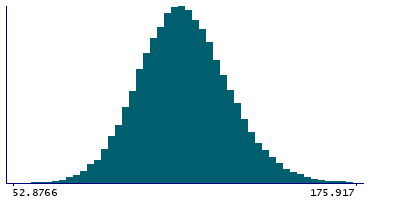
2 Instances
Instance 2 : Imaging visit (2014+)
83,241 participants, 83,241 items
| Maximum | 326.751 |
| Decile 9 | 134.148 |
| Decile 8 | 126.58 |
| Decile 7 | 121.266 |
| Decile 6 | 116.81 |
| Median | 112.77 |
| Decile 4 | 108.832 |
| Decile 3 | 104.649 |
| Decile 2 | 99.8088 |
| Decile 1 | 93.2624 |
| Minimum | 18.3134 |
|

|
- Mean = 113.363
- Std.dev = 16.2932
- 11 items below graph minimum of 52.3769
- 59 items above graph maximum of 175.034
|
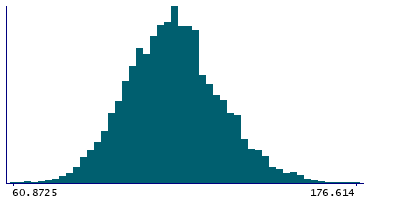
Instance 3 : First repeat imaging visit (2019+)
4,755 participants, 4,755 items
| Maximum | 610.062 |
| Decile 9 | 135.835 |
| Decile 8 | 127.802 |
| Decile 7 | 122.235 |
| Decile 6 | 118.282 |
| Median | 114.516 |
| Decile 4 | 110.596 |
| Decile 3 | 106.403 |
| Decile 2 | 101.648 |
| Decile 1 | 95.065 |
| Minimum | 60.8725 |
|
|
- Mean = 115.134
- Std.dev = 17.9092
- 6 items above graph maximum of 176.606
|
Notes
Volume of MGN in the right hemisphere generated by subcortical volumetric sub-segmentation of the Thalamic Nuclei
0 Related Data-Fields
There are no related data-fields
0 Resources
There are no matching Resources
