Data
87,996 items of data are available, covering 83,313 participants.
Defined-instances run from 2 to 3, labelled using Instancing
2.
Units of measurement are mm3.
| Maximum | 2172.5 |
| Decile 9 | 1051 |
| Decile 8 | 916 |
| Decile 7 | 824.3 |
| Decile 6 | 749.9 |
| Median | 683.9 |
| Decile 4 | 621.95 |
| Decile 3 | 560.9 |
| Decile 2 | 494.9 |
| Decile 1 | 415.8 |
| Minimum | 82.1 |
|
|
- Mean = 713.422
- Std.dev = 249.463
- 92 items above graph maximum of 1686.2
|
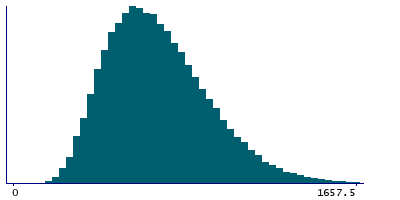
2 Instances
Instance 2 : Imaging visit (2014+)
83,241 participants, 83,241 items
| Maximum | 2172.5 |
| Decile 9 | 1053.3 |
| Decile 8 | 918.4 |
| Decile 7 | 826.5 |
| Decile 6 | 751.8 |
| Median | 685.6 |
| Decile 4 | 623.5 |
| Decile 3 | 562.25 |
| Decile 2 | 495.8 |
| Decile 1 | 416.8 |
| Minimum | 82.1 |
|

|
- Mean = 715.086
- Std.dev = 249.909
- 85 items above graph maximum of 1689.8
|
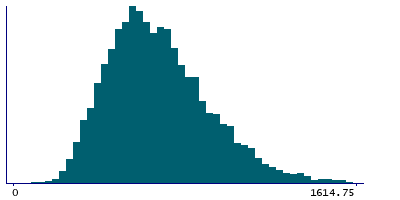
Instance 3 : First repeat imaging visit (2019+)
4,755 participants, 4,755 items
| Maximum | 1948.4 |
| Decile 9 | 1009.65 |
| Decile 8 | 872.8 |
| Decile 7 | 784.95 |
| Decile 6 | 716.4 |
| Median | 653.2 |
| Decile 4 | 595.2 |
| Decile 3 | 541.1 |
| Decile 2 | 480.1 |
| Decile 1 | 404.55 |
| Minimum | 101.6 |
|
|
- Mean = 684.303
- Std.dev = 239.666
- 6 items above graph maximum of 1614.75
|
Notes
Volume of choroid-plexus in the right hemisphere generated by subcortical volumetric segmentation (aseg)
0 Related Data-Fields
There are no related data-fields
0 Resources
There are no matching Resources
