Data
87,996 items of data are available, covering 83,313 participants.
Defined-instances run from 2 to 3, labelled using Instancing
2.
Units of measurement are AU.
| Maximum | 83.983 |
| Decile 9 | 71.7433 |
| Decile 8 | 70.9025 |
| Decile 7 | 70.337 |
| Decile 6 | 69.8738 |
| Median | 69.4571 |
| Decile 4 | 69.0495 |
| Decile 3 | 68.6032 |
| Decile 2 | 68.0583 |
| Decile 1 | 67.2947 |
| Minimum | 39.9776 |
|
|
- Mean = 69.4904
- Std.dev = 1.7899
- 68 items below graph minimum of 62.846
- 70 items above graph maximum of 76.192
|
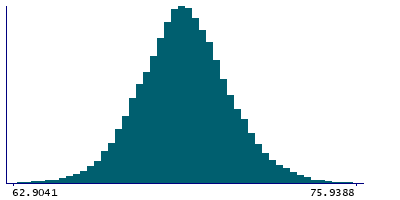
2 Instances
Instance 2 : Imaging visit (2014+)
83,241 participants, 83,241 items
| Maximum | 83.983 |
| Decile 9 | 71.7651 |
| Decile 8 | 70.9189 |
| Decile 7 | 70.3487 |
| Decile 6 | 69.8855 |
| Median | 69.4695 |
| Decile 4 | 69.0602 |
| Decile 3 | 68.6144 |
| Decile 2 | 68.0687 |
| Decile 1 | 67.3029 |
| Minimum | 39.9776 |
|

|
- Mean = 69.5024
- Std.dev = 1.79442
- 62 items below graph minimum of 62.8406
- 66 items above graph maximum of 76.2273
|
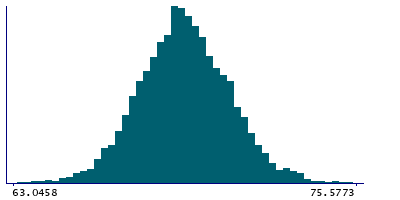
Instance 3 : First repeat imaging visit (2019+)
4,755 participants, 4,755 items
| Maximum | 77.5768 |
| Decile 9 | 71.4001 |
| Decile 8 | 70.68 |
| Decile 7 | 70.1111 |
| Decile 6 | 69.6501 |
| Median | 69.2544 |
| Decile 4 | 68.8824 |
| Decile 3 | 68.4323 |
| Decile 2 | 67.9087 |
| Decile 1 | 67.2234 |
| Minimum | 54.6359 |
|
|
- Mean = 69.2809
- Std.dev = 1.69524
- 5 items below graph minimum of 63.0468
- 6 items above graph maximum of 75.5768
|
Notes
Mean intensity of Amygdala in the right hemisphere generated by subcortical volumetric segmentation (aseg)
0 Related Data-Fields
There are no related data-fields
0 Resources
There are no matching Resources
