Data
87,996 items of data are available, covering 83,313 participants.
Defined-instances run from 2 to 3, labelled using Instancing
2.
Units of measurement are AU.
| Maximum | 51.0486 |
| Decile 9 | 35.1606 |
| Decile 8 | 33.3021 |
| Decile 7 | 32.063 |
| Decile 6 | 31.067 |
| Median | 30.1766 |
| Decile 4 | 29.316 |
| Decile 3 | 28.3798 |
| Decile 2 | 27.2706 |
| Decile 1 | 25.5035 |
| Minimum | 9.825 |
|
|
- Mean = 30.1733
- Std.dev = 4.13621
- 384 items below graph minimum of 15.8465
- 61 items above graph maximum of 44.8176
|
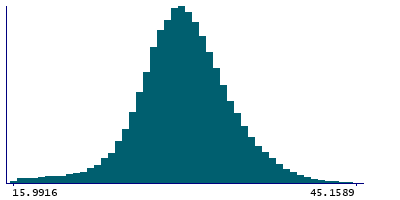
2 Instances
Instance 2 : Imaging visit (2014+)
83,241 participants, 83,241 items
| Maximum | 51.0486 |
| Decile 9 | 35.1422 |
| Decile 8 | 33.2776 |
| Decile 7 | 32.0362 |
| Decile 6 | 31.038 |
| Median | 30.1476 |
| Decile 4 | 29.2895 |
| Decile 3 | 28.3486 |
| Decile 2 | 27.2445 |
| Decile 1 | 25.4784 |
| Minimum | 9.825 |
|

|
- Mean = 30.1464
- Std.dev = 4.13213
- 359 items below graph minimum of 15.8147
- 57 items above graph maximum of 44.8059
|
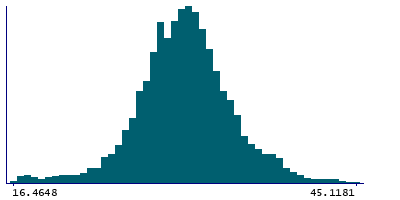
Instance 3 : First repeat imaging visit (2019+)
4,755 participants, 4,755 items
| Maximum | 45.2835 |
| Decile 9 | 35.567 |
| Decile 8 | 33.6804 |
| Decile 7 | 32.49 |
| Decile 6 | 31.5651 |
| Median | 30.734 |
| Decile 4 | 29.8825 |
| Decile 3 | 28.8527 |
| Decile 2 | 27.7855 |
| Decile 1 | 26.0159 |
| Minimum | 11.9312 |
|
|
- Mean = 30.6441
- Std.dev = 4.17905
- 28 items below graph minimum of 16.4648
- 3 items above graph maximum of 45.1181
|
Notes
Mean intensity of Lateral-Ventricle in the right hemisphere generated by subcortical volumetric segmentation (aseg)
0 Related Data-Fields
There are no related data-fields
0 Resources
There are no matching Resources
