Data
87,995 items of data are available, covering 83,312 participants.
Defined-instances run from 2 to 3, labelled using Instancing
2.
Units of measurement are mm3.
| Maximum | 15166.1 |
| Decile 9 | 7684.8 |
| Decile 8 | 7329.5 |
| Decile 7 | 7089.4 |
| Decile 6 | 6892.2 |
| Median | 6715.6 |
| Decile 4 | 6541.3 |
| Decile 3 | 6361.4 |
| Decile 2 | 6159.1 |
| Decile 1 | 5894.7 |
| Minimum | 3833 |
|
|
- Mean = 6760.51
- Std.dev = 713.252
- 2 items below graph minimum of 4104.6
- 101 items above graph maximum of 9474.9
|
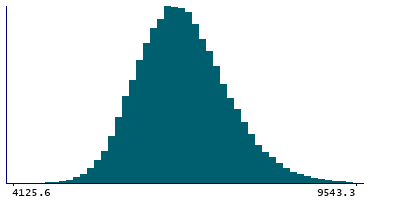
2 Instances
Instance 2 : Imaging visit (2014+)
83,240 participants, 83,240 items
| Maximum | 15166.1 |
| Decile 9 | 7679.8 |
| Decile 8 | 7323 |
| Decile 7 | 7084.7 |
| Decile 6 | 6887.5 |
| Median | 6710.8 |
| Decile 4 | 6535.7 |
| Decile 3 | 6356.4 |
| Decile 2 | 6154.9 |
| Decile 1 | 5890.9 |
| Minimum | 3833 |
|

|
- Mean = 6755.77
- Std.dev = 712.94
- 2 items below graph minimum of 4102
- 95 items above graph maximum of 9468.7
|
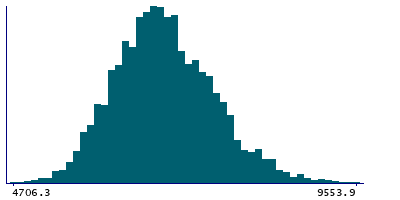
Instance 3 : First repeat imaging visit (2019+)
4,755 participants, 4,755 items
| Maximum | 12289.3 |
| Decile 9 | 7756.7 |
| Decile 8 | 7431.7 |
| Decile 7 | 7178.15 |
| Decile 6 | 6967.7 |
| Median | 6792.1 |
| Decile 4 | 6625.1 |
| Decile 3 | 6453.75 |
| Decile 2 | 6246.2 |
| Decile 1 | 5961.9 |
| Minimum | 4706.3 |
|
|
- Mean = 6843.62
- Std.dev = 713.602
- 4 items above graph maximum of 9551.5
|
Notes
Volume of Thalamus-Proper in the left hemisphere generated by subcortical volumetric segmentation (aseg)
0 Related Data-Fields
There are no related data-fields
0 Resources
There are no matching Resources
