Data
87,996 items of data are available, covering 83,313 participants.
Defined-instances run from 2 to 3, labelled using Instancing
2.
Units of measurement are AU.
| Maximum | 115.556 |
| Decile 9 | 101.441 |
| Decile 8 | 100.189 |
| Decile 7 | 99.339 |
| Decile 6 | 98.6213 |
| Median | 97.9432 |
| Decile 4 | 97.252 |
| Decile 3 | 96.4412 |
| Decile 2 | 95.4216 |
| Decile 1 | 93.7212 |
| Minimum | 63.9758 |
|

|
- Mean = 97.6376
- Std.dev = 3.32347
- 681 items below graph minimum of 86.0018
- 1 item above graph maximum of 109.16
|
2 Instances
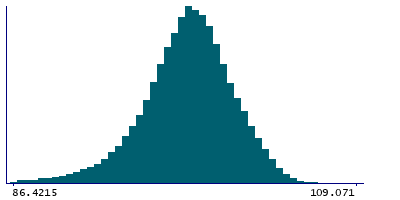
Instance 2 : Imaging visit (2014+)
83,241 participants, 83,241 items
| Maximum | 115.556 |
| Decile 9 | 101.43 |
| Decile 8 | 100.181 |
| Decile 7 | 99.3315 |
| Decile 6 | 98.6114 |
| Median | 97.9314 |
| Decile 4 | 97.2399 |
| Decile 3 | 96.4295 |
| Decile 2 | 95.4049 |
| Decile 1 | 93.698 |
| Minimum | 63.9758 |
|
|
- Mean = 97.6238
- Std.dev = 3.33312
- 645 items below graph minimum of 85.9655
- 1 item above graph maximum of 109.163
|
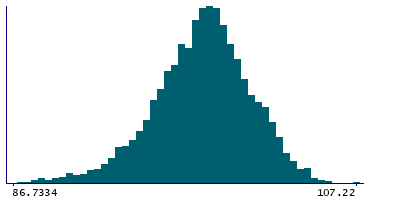
Instance 3 : First repeat imaging visit (2019+)
4,755 participants, 4,755 items
| Maximum | 107.22 |
| Decile 9 | 101.577 |
| Decile 8 | 100.336 |
| Decile 7 | 99.4746 |
| Decile 6 | 98.8043 |
| Median | 98.1452 |
| Decile 4 | 97.4707 |
| Decile 3 | 96.6625 |
| Decile 2 | 95.6935 |
| Decile 1 | 94.1568 |
| Minimum | 71.8115 |
|
|
- Mean = 97.8803
- Std.dev = 3.13987
- 36 items below graph minimum of 86.7365
|
Notes
Mean intensity of CC-Anterior in the whole brain generated by subcortical volumetric segmentation (aseg)
0 Related Data-Fields
There are no related data-fields
0 Resources
There are no matching Resources
