Data
87,996 items of data are available, covering 83,313 participants.
Defined-instances run from 2 to 3, labelled using Instancing
2.
Units of measurement are AU.
| Maximum | 48.8143 |
| Decile 9 | 34.9461 |
| Decile 8 | 33.7419 |
| Decile 7 | 32.866 |
| Decile 6 | 32.105 |
| Median | 31.3952 |
| Decile 4 | 30.6712 |
| Decile 3 | 29.8755 |
| Decile 2 | 28.8766 |
| Decile 1 | 27.3291 |
| Minimum | 13.2346 |
|

|
- Mean = 31.2023
- Std.dev = 3.1852
- 335 items below graph minimum of 19.7121
- 14 items above graph maximum of 42.5631
|
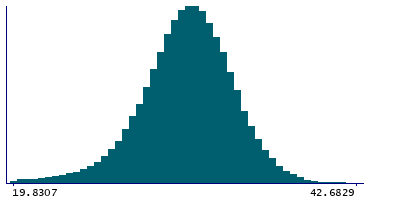
2 Instances
Instance 2 : Imaging visit (2014+)
83,241 participants, 83,241 items
| Maximum | 48.8143 |
| Decile 9 | 34.9529 |
| Decile 8 | 33.7476 |
| Decile 7 | 32.8709 |
| Decile 6 | 32.1117 |
| Median | 31.4036 |
| Decile 4 | 30.6766 |
| Decile 3 | 29.8843 |
| Decile 2 | 28.8837 |
| Decile 1 | 27.3377 |
| Minimum | 13.2346 |
|
|
- Mean = 31.2097
- Std.dev = 3.18224
- 316 items below graph minimum of 19.7225
- 13 items above graph maximum of 42.5681
|
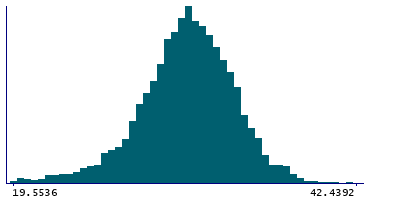
Instance 3 : First repeat imaging visit (2019+)
4,755 participants, 4,755 items
| Maximum | 42.5931 |
| Decile 9 | 34.8107 |
| Decile 8 | 33.6632 |
| Decile 7 | 32.758 |
| Decile 6 | 32 |
| Median | 31.2607 |
| Decile 4 | 30.5753 |
| Decile 3 | 29.7654 |
| Decile 2 | 28.7497 |
| Decile 1 | 27.1872 |
| Minimum | 14.4962 |
|
|
- Mean = 31.0725
- Std.dev = 3.23392
- 22 items below graph minimum of 19.5637
- 1 item above graph maximum of 42.4342
|
Notes
Mean intensity of 4th-Ventricle in the whole brain generated by subcortical volumetric segmentation (aseg)
0 Related Data-Fields
There are no related data-fields
0 Resources
There are no matching Resources
