Data
38,799 items of data are available, covering 34,864 participants.
Defined-instances run from 2 to 3, labelled using Instancing
2.
Units of measurement are miliseconds.
| Maximum | 8817 |
| Decile 9 | 4612 |
| Decile 8 | 4050 |
| Decile 7 | 3633 |
| Decile 6 | 3307 |
| Median | 3018 |
| Decile 4 | 2754 |
| Decile 3 | 2476 |
| Decile 2 | 2194 |
| Decile 1 | 1856 |
| Minimum | 302 |
|
|
- There are 5202 distinct values.
- Mean = 3143.3
- Std.dev = 1077.93
- 26 items above graph maximum of 7368
|
2 Instances
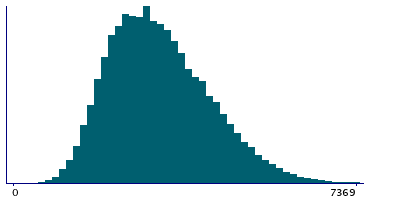
Instance 2 : Imaging visit (2014+)
33,840 participants, 33,840 items
| Maximum | 8405 |
| Decile 9 | 4635 |
| Decile 8 | 4069 |
| Decile 7 | 3655 |
| Decile 6 | 3323 |
| Median | 3036 |
| Decile 4 | 2768 |
| Decile 3 | 2490 |
| Decile 2 | 2207 |
| Decile 1 | 1869 |
| Minimum | 302 |
|

|
- There are 5100 distinct values.
- Mean = 3160.47
- Std.dev = 1081.65
- 21 items above graph maximum of 7401
|
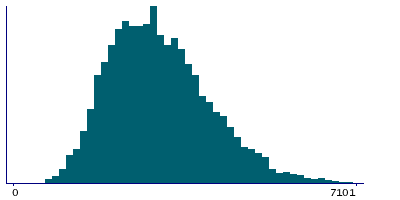
Instance 3 : First repeat imaging visit (2019+)
4,959 participants, 4,959 items
| Maximum | 8817 |
| Decile 9 | 4442.5 |
| Decile 8 | 3862.5 |
| Decile 7 | 3498.5 |
| Decile 6 | 3196 |
| Median | 2909 |
| Decile 4 | 2648.5 |
| Decile 3 | 2380 |
| Decile 2 | 2113 |
| Decile 1 | 1778 |
| Minimum | 687 |
|
|
- There are 2755 distinct values.
- Mean = 3026.17
- Std.dev = 1044.75
- 3 items above graph maximum of 7107
|
Notes
Estimates the basic visuomotor processing times of a participant (i.e. regardless of the actual cognitive difficulty of the trial).
0 Related Data-Fields
There are no related data-fields


